Subscribe 

Personal Finance. Simplified
Helping you plan your finances better.
2nd
most influential
financial services brand
150,000+
Monthly readers
100,000+
Happy investors
20,000 Cr+
AUM Handled
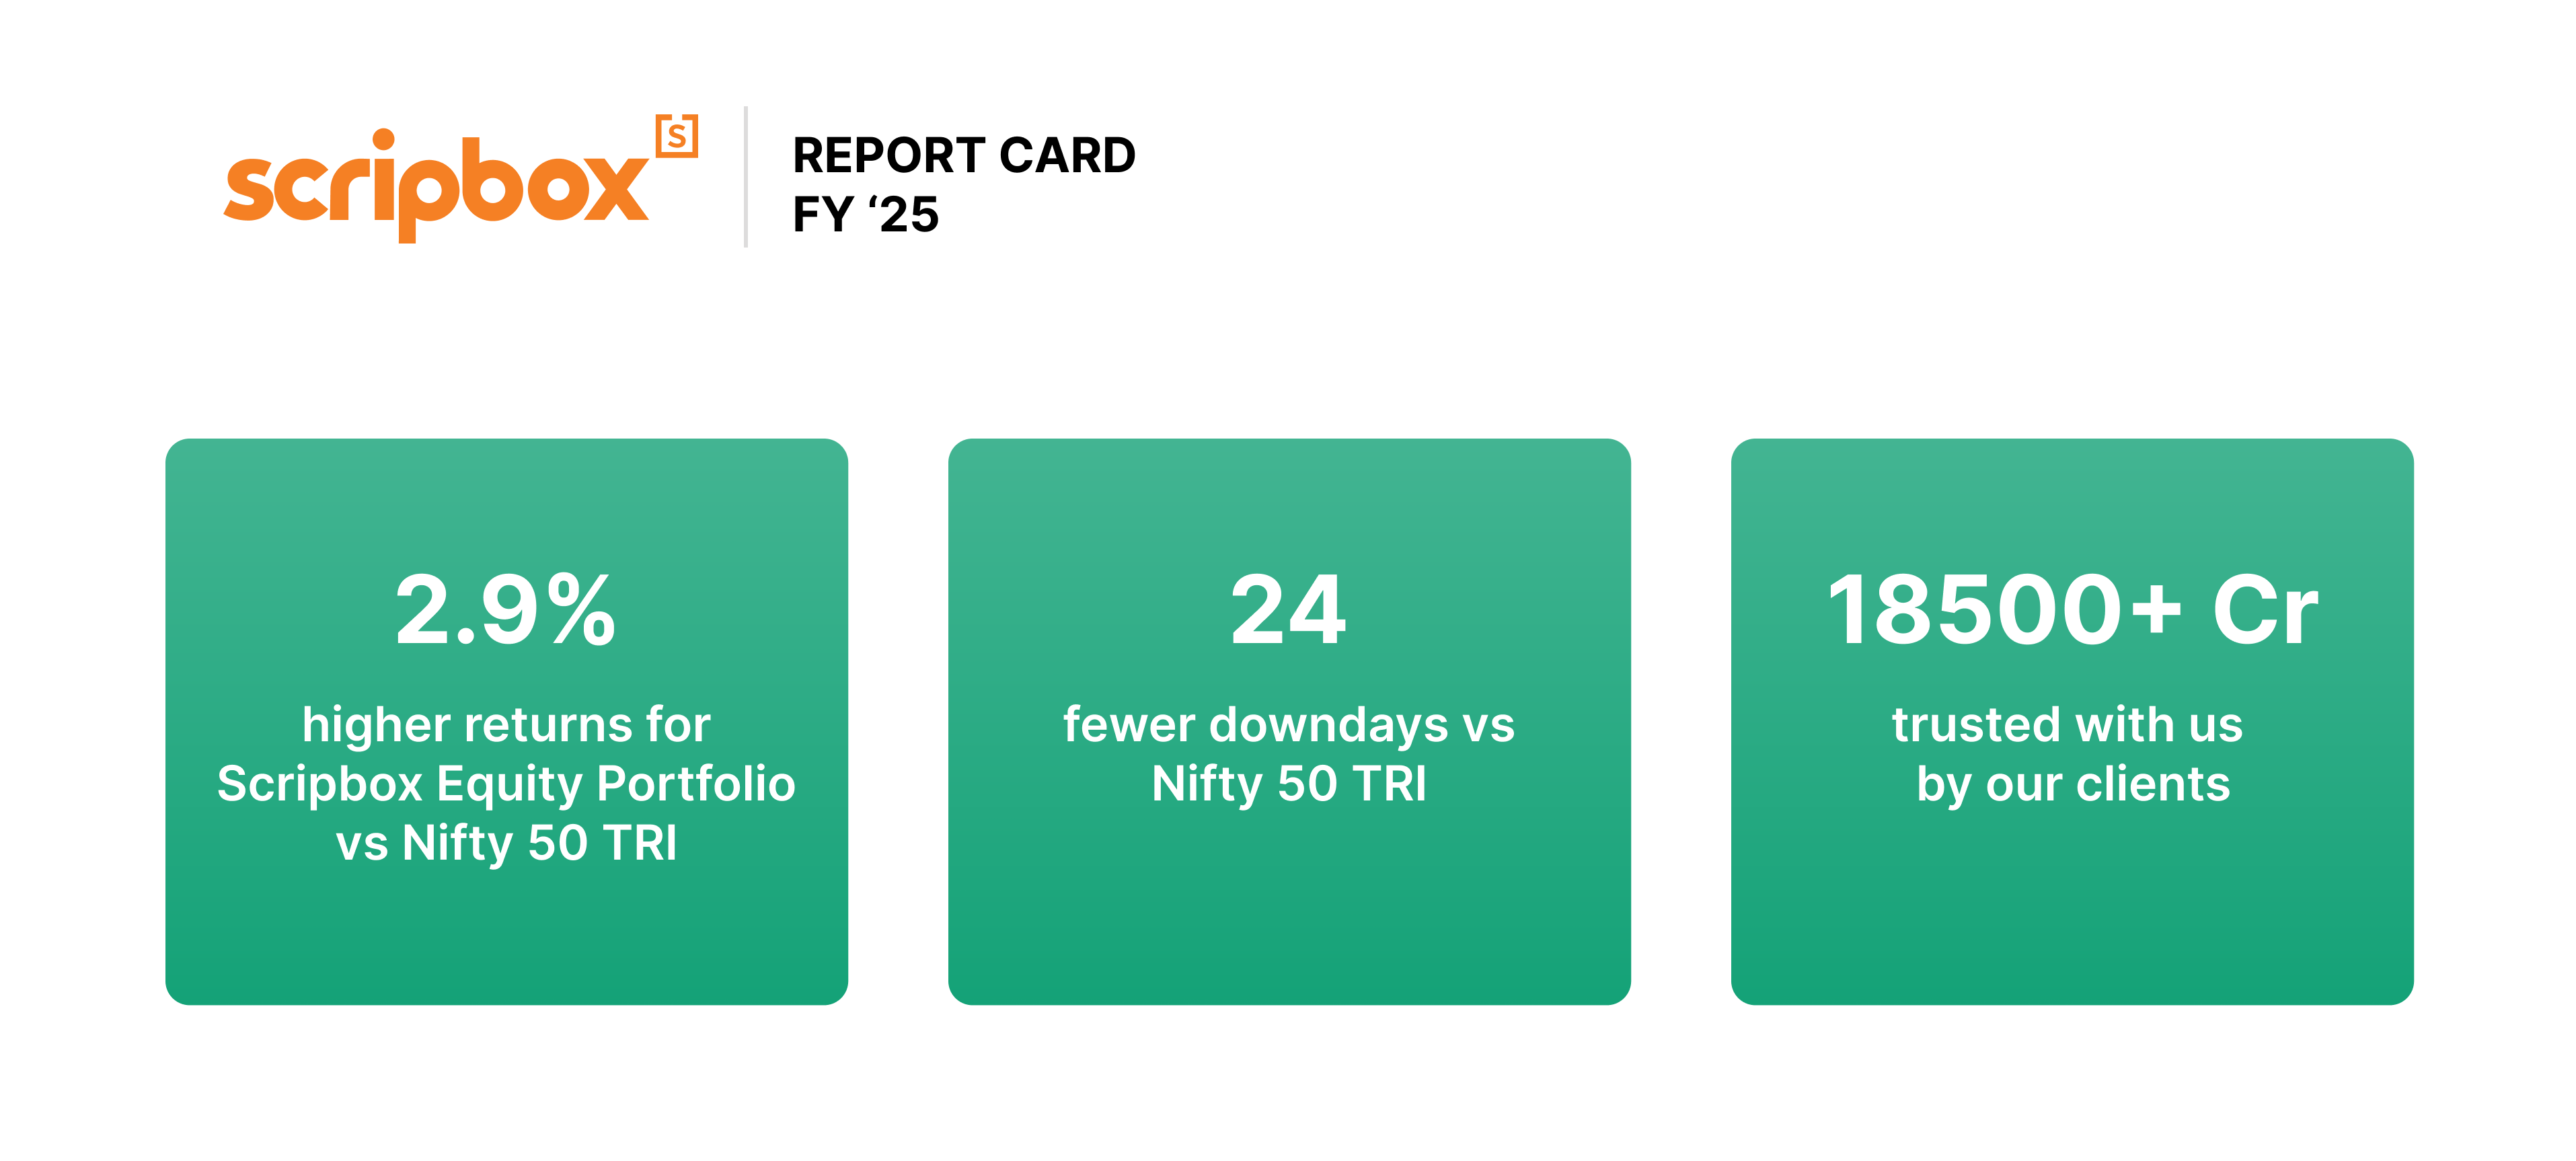
Report Card
2024-25 Report Card: Performance of Scripbox Recommended Mutual Fund Portfolio

Wealth Letters
The storm outside, the structure inside
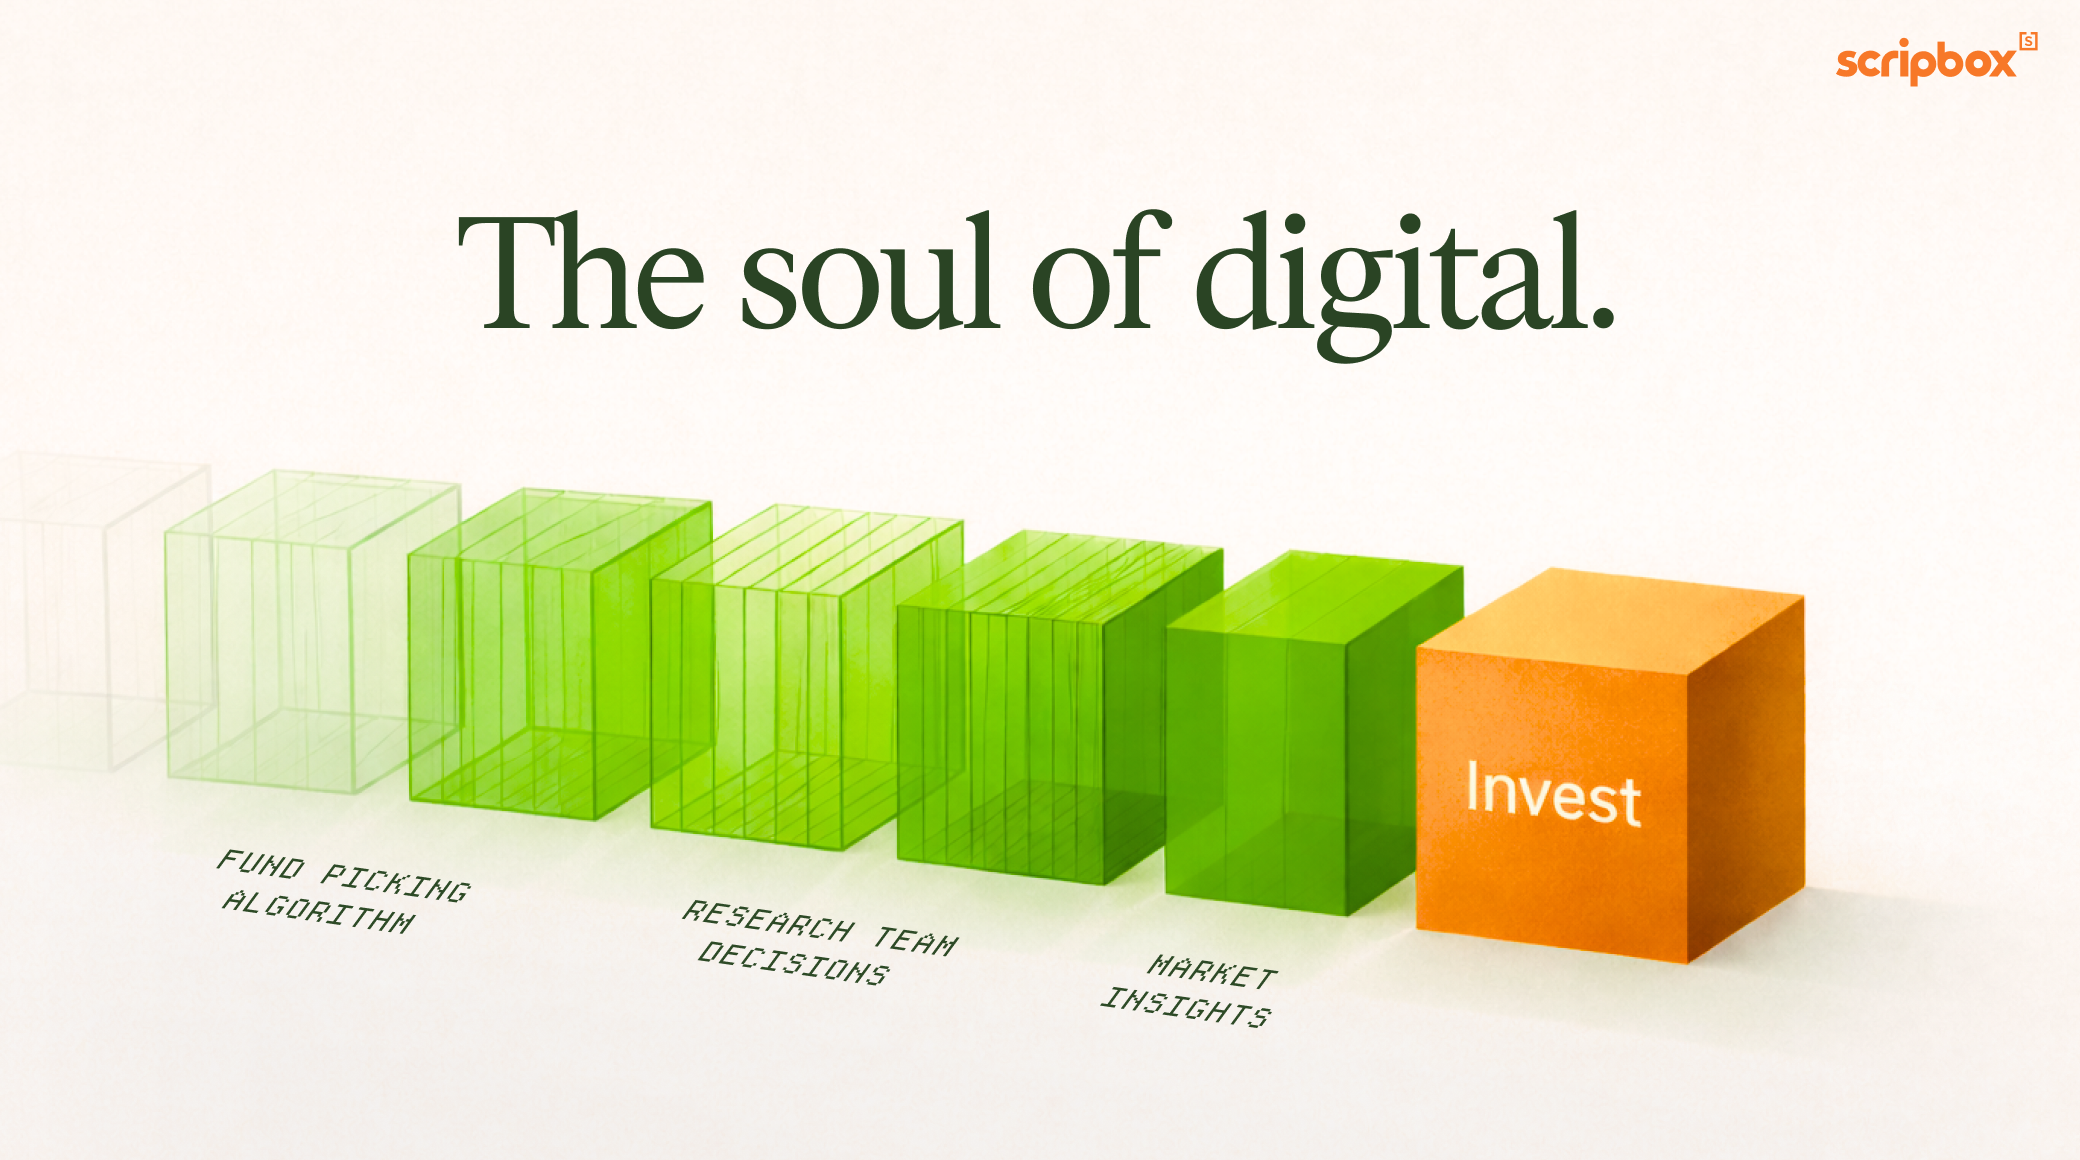
Wealth Letters
The soul of “digital” in digital wealth management


From the
Founder's Desk.

Our Finance Planners


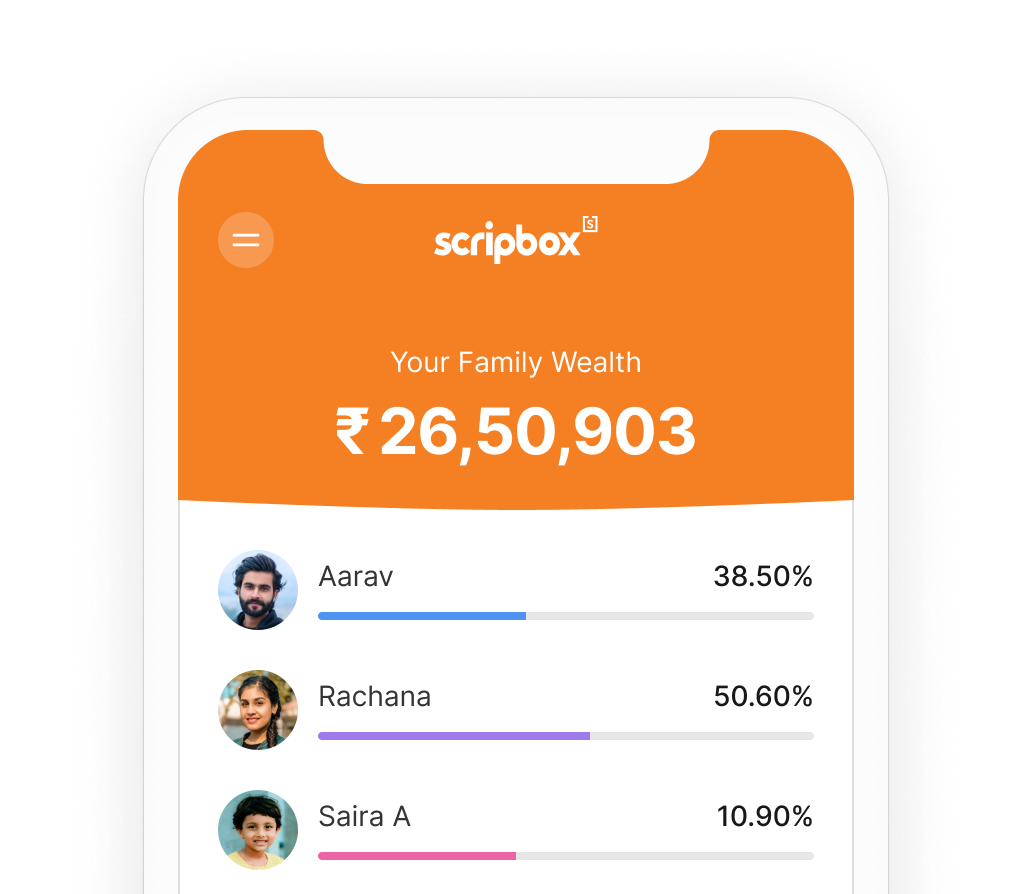
One home, and one app, for all your wealth
View, analyse, manage, and invest your and your family's wealth with the all-new Scripbox App.


One home, and one app, for all your wealth
View, analyse, manage, and invest your and your family's wealth with the all-new Scripbox App.


