
Share
Momentum indicators help traders understand the speed at which prices of a stock change. Furthermore, they also help in understanding the strength of the price movements. Momentum indicators complement other tools and indicators and help pinpoint the time period where the price change can occur. This article covers what is a momentum indicator, the best momentum indicators and their advantages and disadvantages.
Confused if your portfolio is performing right enough to meet your goals?

What is a Momentum Indicator?
Momentum indicators are technical analysis tools that help predict the price movements of a stock. The momentum indicators help in determining the speed or rate at which stock prices change. The main components to determine a stock’s momentum are price movement, current price, and closing price.
Momentum indicators are also known as oscillators that are depicted by a line. The price oscillation line is around 100. This oscillation line helps in analysing the stock prices and trends.
Historically seen, momentum indicators have been useful in a bull market trend rather than in a bear market trend. Furthermore, momentum indicators may suggest a stock is being overbought or oversold. As a result, it weakens the momentum and signals a trend reversal.
There are more than 20 momentum indicators that help in analysing the stocks. However, the most popular ones are MACD, ADX, RSI, ROC and Stochastic Oscillator.
There are two types of indicators:
- Leading Indicators: Leading indicators lead the price movements. In other words, they signal entry and exit opportunities.
- Lagging Indicators: Lagging indicators follow a trend rather than predicting a trend reversal. Lagging indicators follow an event and therefore work well when price movements are for a relatively long duration. As a result they confirm price movements, so you may invest accordingly.
How to Calculate Momentum Indicator?
The momentum of a stock is the difference between the current closing price of the stock and the closing price ‘n’ days ago. Author John J. Murphy in his “Technical Analysis of the Financial Markets’ book, constructs a 10-day momentum line and plots it against the zero line.
Momentum = Current Closing Price – Closing Price ‘n’ days ago
Momentum value can be either positive or negative. Traders and analysts typically use the 10-day movement for measuring a stock’s momentum.
The zero line is the area where the stock has no trend or is trading sideways. When the stock’s momentum increases (positively or negatively), the momentum line moves away from the zero line.
If the current closing price of the stock is higher than the closing price 10 days ago, then the positive value is plotted above the zero line. On the contrary, if the current closing price is lower than the 10-day price, the negative value is plotted below the zero line.
The following graph shows the momentum for ITC Ltd.

Types of Momentum Indicators
Moving Average Convergence/Divergence (MACD)
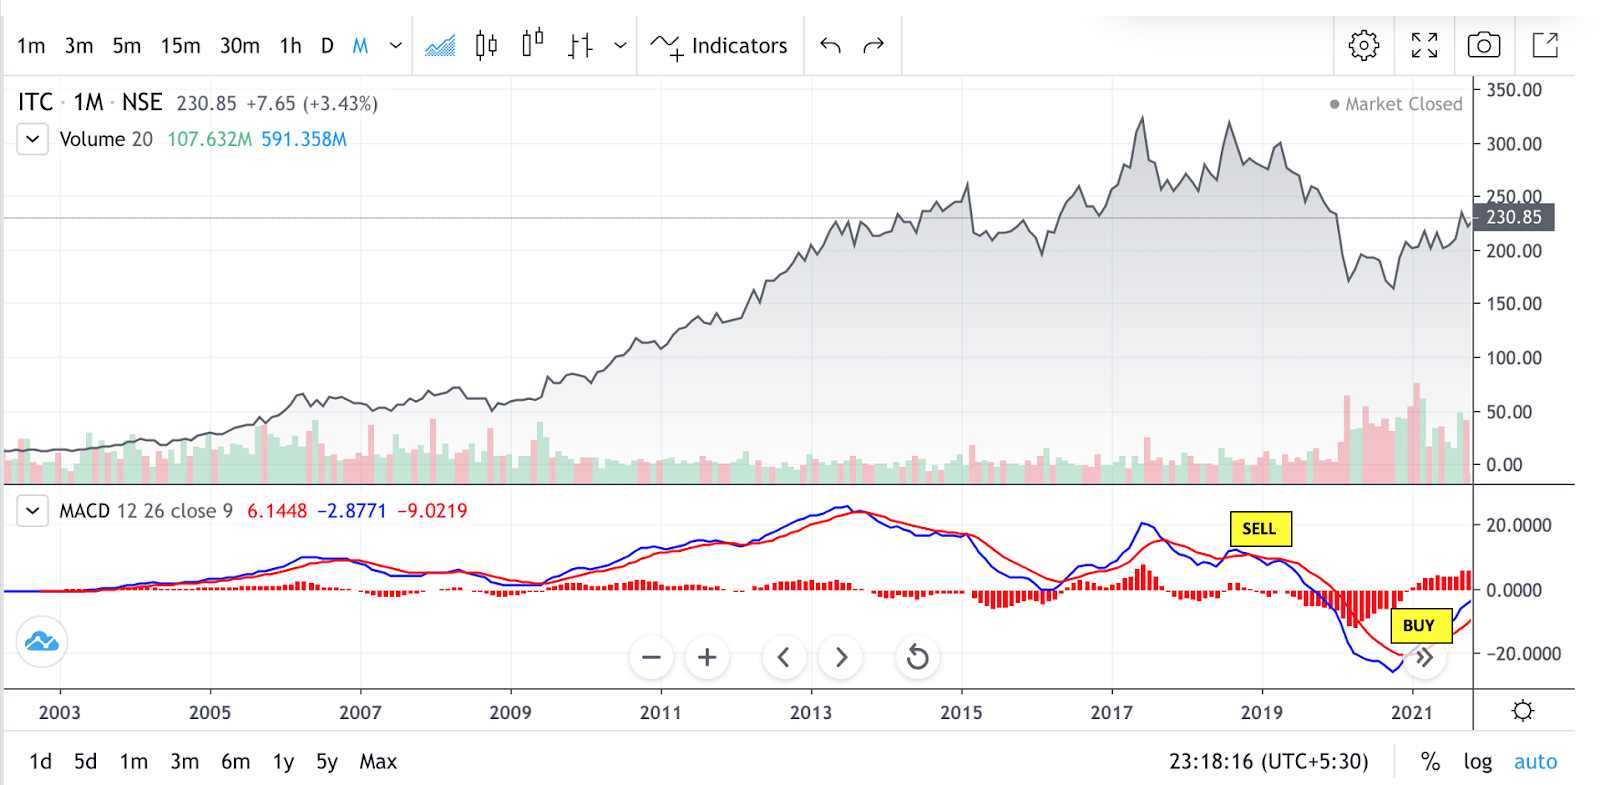
MACD is the most popular momentum indicator. It is the difference between the 26-day Exponential Moving Average (EMA) and 12-day EMA. The graph consists of two lines: MACD Line and Signal Line.
MACD Line = 26-day EMA – 12-day EMA
Signal Line = 9-day EMA
MACD is a lagging indicator. When the MACD line cuts the signal line from below, it is a buy signal. On the other hand, when the MACD line cuts the signal line from above, then it is a sell signal. Bullish and bearish divergences of the MACD also signal to buy and sell calls.
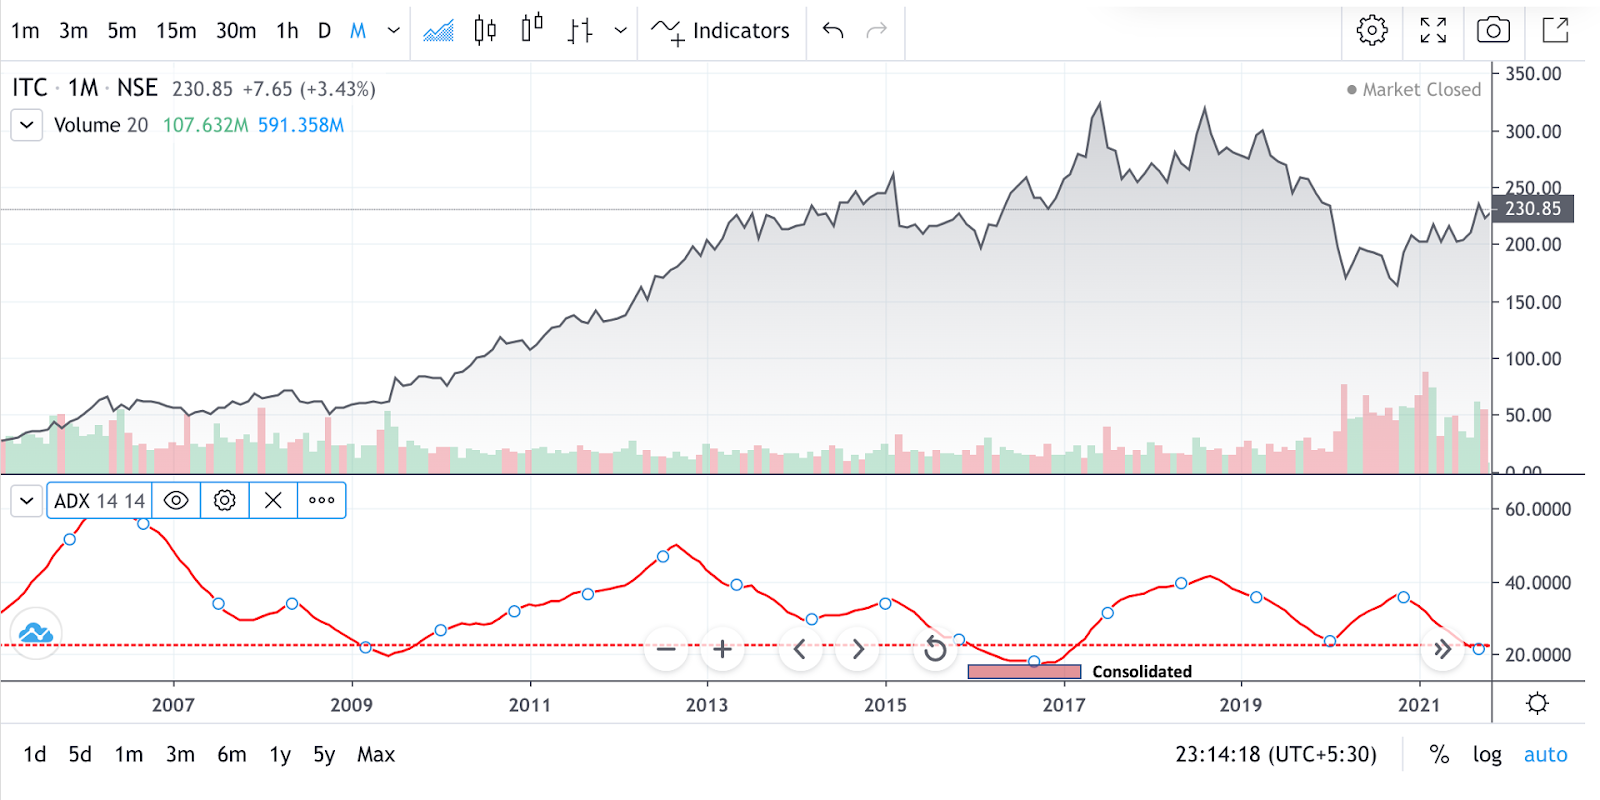
Average Directional Index (ADX)
The ADX indicator helps to understand the strength of a trend. The ADX with a value of 20 and above indicated that the markets are trending. The reading with an ADX less than 20 is perceived as directionless or consolidated.
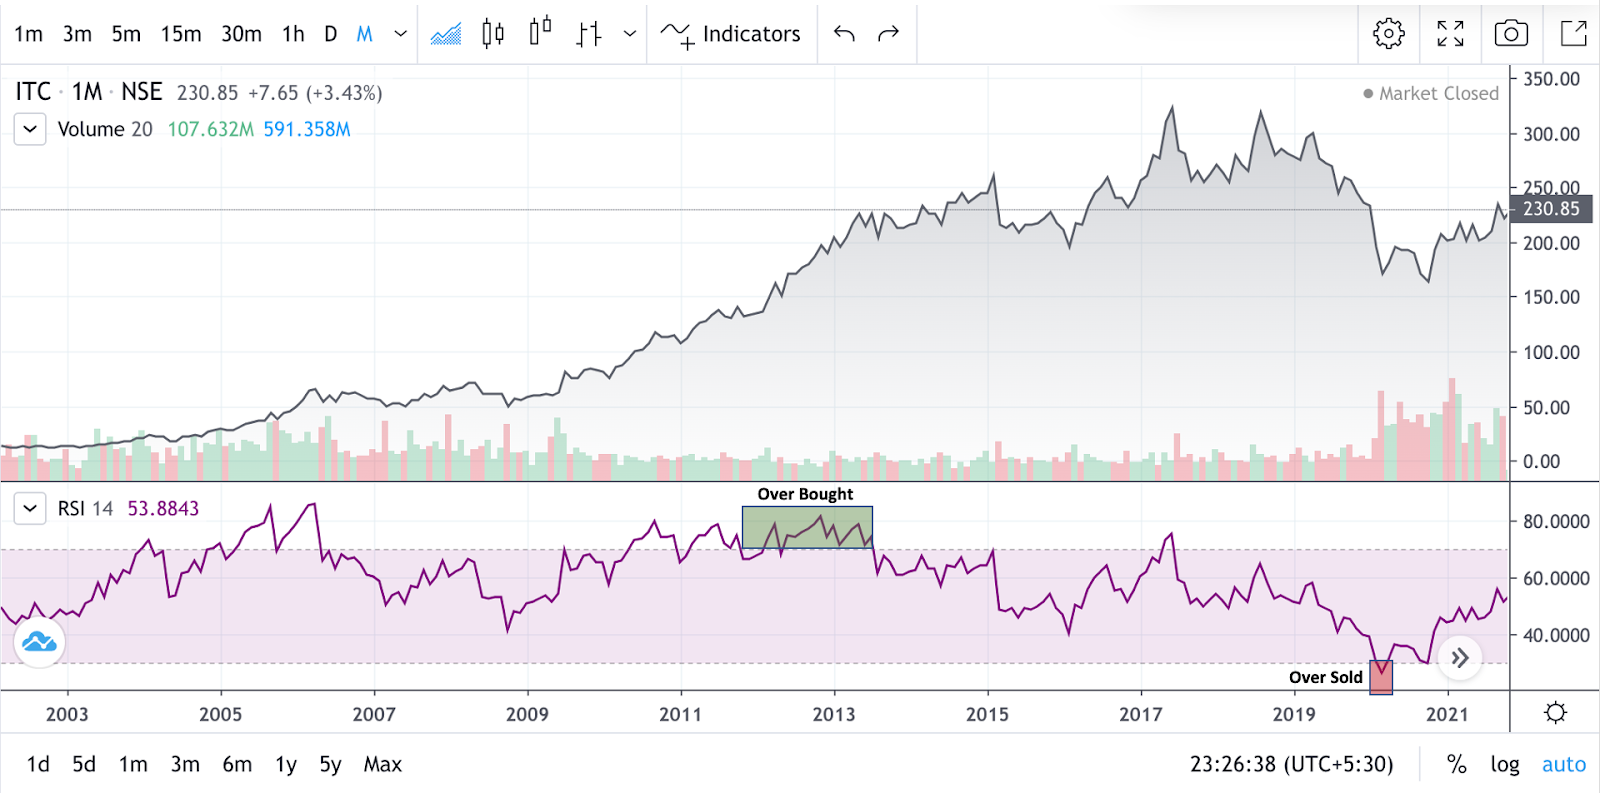
Relative Strength Index (RSI)
Another popular indicator, RSI is a metric for tracking price changes and the speed at which the prices change. The RSI oscillates between 0 to 100, 50 being the centerline. When the RSI is above the centreline, it indicates an uptrend. But if the RSI is above 70, it indicates overbought conditions. On the contrary, if the RSI is below 50, it indicates a downtrend. If the RSI is below 30, it indicates oversold conditions. RSI Is a leading indicator that offers early signalling of entry and exit.
RSI = 100 * (average of ‘n’ up closes) / (average of ‘n’ up closes + average of ‘n’ down closes)
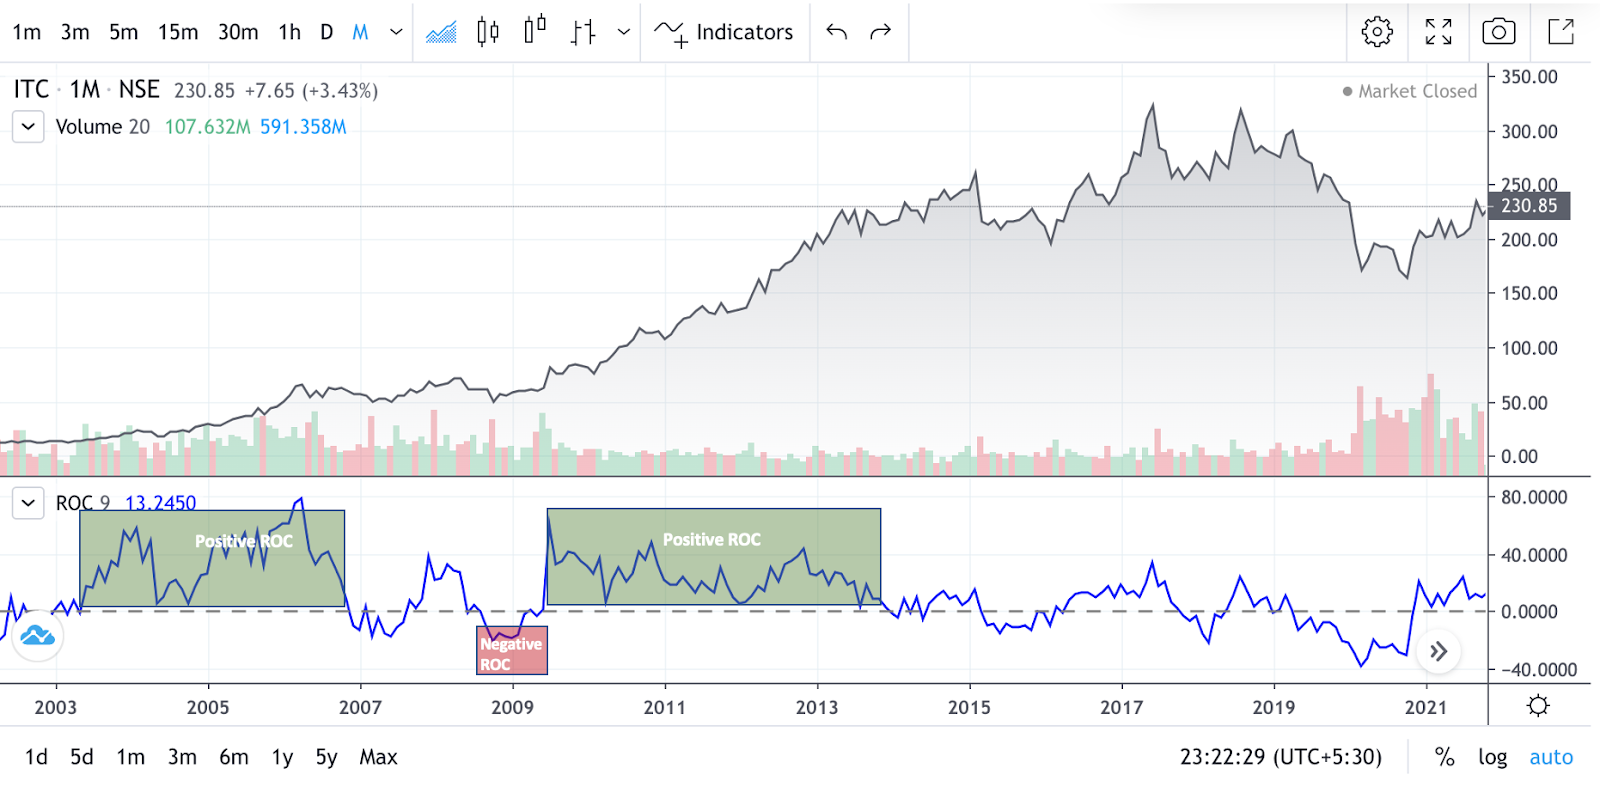
Rate of Change (ROC)
The rate of change determines the speed at which the price of a stock change over a particular period of time (‘n’ number of days ago). It is expressed as a ratio between the current closing price and the closing price ‘n’ days ago. A positive ROC implies high momentum and indicates a buy signal. On the other hand, a negative ROC implies low momentum indicating a sell signal.
ROC = [(Today’s Closing Price – Closing Price ‘n’ days ago) / Closing Price ‘n’ days ago] x 100
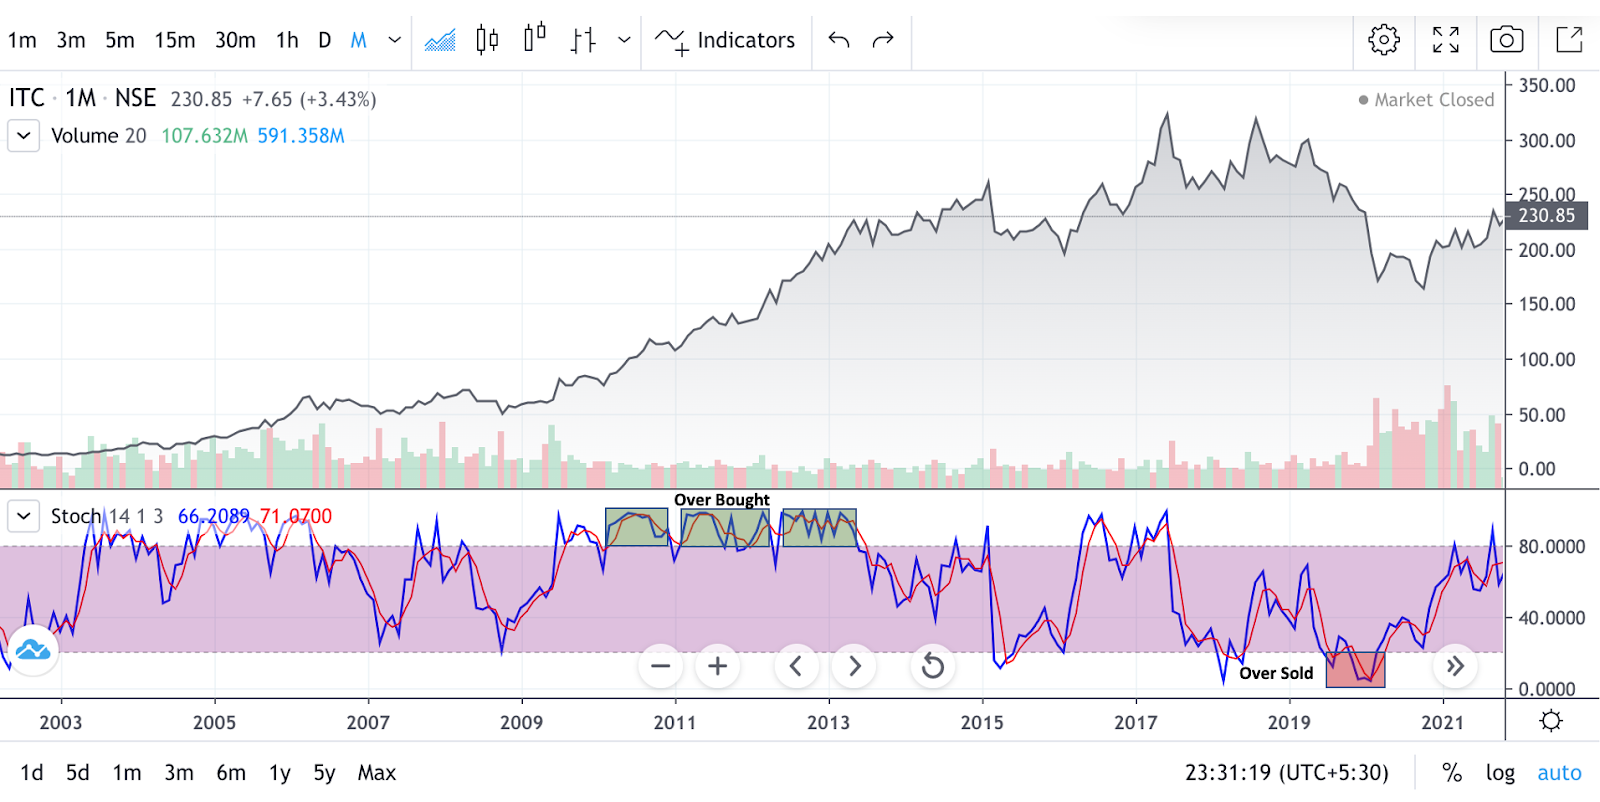
Stochastic Oscillator
The Stochastic Oscillator compares the current closing price of a stock over a particular period of time. It tracks both the momentum and speed at which the stock prices change. However, it doesn’t consider the price and volume. It is a leading indicator that offers early signalling of entry and exit.
It oscillates between 0 and 100 and helps in identifying the overbought and oversold zones of a stock. Above 80 indicates an overbought zone and below 20 indicates an oversold zone.
What is Divergence?
Divergence is the disagreement between the indicator and the stock price movement. For a divergence to occur, there can be many factors that affect the stock prices. In an uptrend, divergence happens when the price achieves a higher high while the indicator does not.
Divergence occurs in a downtrend when the price makes a lower bottom, but the indicator does not. In other words, the divergences between the indicators and the price movement indicate, the momentum of the current stock price movement is failing. When price divergence is detected, a price retracement is more likely.
Divergence aids the trader in recognising and reacting to price action changes. It indicates that something is changing, and the trader must act. However, it does not mean a trend reversal is guaranteed. It is just a mere signal for the trader to consider different strategies — hold, sell, partially book profits, etc.
How To Use Momentum Indicators?
Momentum indicators are useful for identifying trade signals. Moreover, they also help in confirming the validity of trade on the basis of the price movements like pullbacks or breakouts. The following ways will help traders use the momentum indicators for trading:
Crossovers
Crossovers are when the momentum indicators cross the middle line or other lines. These cross overs trigger trade signals.
For example, the MACD Line oscillates above and below the centerline (zero line). Crossovers can be two types:
- Signal Line Crossovers: Signal line crossovers are one of the most common MACD signals. When the MACD turns up and crosses above the signal line, a bullish trend occurs. On the other hand, when the MACD turns down and crosses below the signal line, a bearish trend occurs.
- Center Line Crossovers: When the MACD crosses over the centerline (zero line) and moves up, a bullish trend occurs. This happens when the 12-day Exponential Moving Average (EMA) of the stock moves above the 26-day EMA. On the other hand, when the MACD crosses over the zero line and moves down, a bearish trend occurs. However, it is important to note that the trend may last up to a few days or a month, depending on the strength of the trend.
Divergence
When the stock prices move to lower lows while the momentum indicator moves higher, this is known as bullish divergence. Simply put, it means when the stock prices are falling, and the selling momentum is slowing, there may be a trend reversal. The stock prices may witness an uptrend soon.
On the other hand, when the stock prices move to higher highs while the momentum indicator moves lower, this is known as a bearish divergence. In other words, this means, when the stock prices are rising, and the buying momentum is slowing, there may be a trend reversal. The stock prices may witness a downside soon.
Advantages and Disadvantages of Momentum Indicators
Following are the advantages of momentum indicators:
- Price: Momentum indicators show price trends of a financial instrument. Furthermore, they measure the strengths and weaknesses associated with the price movements.
- Trading Decisions: Momentum indicators signal trading decisions. In other words, they help in determining when to enter and exit the markets. The signals can be identified through price divergences.
- Confirm a Trend: Momentum indicators are best suitable to confirm a trading strategy.
Despite the advantages mentioned above, momentum indicators have the following disadvantage:
- Sometimes, momentum indicators can give false results when considered in isolation. Therefore, when analysed alongside technical analysis tools, momentum indicators can help identify trends and price trajectories.


Show comments