

Share
What is a Profitability Ratio?
A company’s profitability ratios are financial metrics that help measure and evaluate its ability to generate profits. These abilities can be assessed through the income statement, balance sheet, shareholder’s equity, or sales processes for a specific period. Furthermore, the profitability ratio indicates how well the company uses its assets to generate profits and provide value to its shareholders.
Confused if your portfolio is performing right enough to meet your goals?

Definition and Importance
Profitability ratios are financial metrics used to assess a company’s ability to generate earnings relative to its revenue, operating costs, balance sheet assets, or shareholders’ equity over time. These ratios are essential for investors, analysts, and financial managers to evaluate a company’s financial performance and well-being. A higher ratio or value is commonly sought-after by most companies, indicating good performance. Profitability ratios are most useful when analyzed in comparison to similar companies or compared to previous periods.
Types of Profitability Ratios
- Gross Profit Margin
- Operating Profit Margin is a key profitability measure that indicates the percentage of profit a company makes from its operations before deducting interest and taxes.
- Net Profit Margin
- Return on Equity (ROE)
- Return on Assets (ROA)
- Return on Capital Employed
Gross Profit Margin
The gross profit margin ratio helps measure how much profit a company generates from its sales of goods and services after deducting direct costs or the cost of goods sold. A higher gross profit indicates that the company can cover operating expenses, fixed costs, depreciation, etc., and generate net Income. In contrast, a low gross profit margin reflects poorly on the company, indicating high selling prices, low sales, high costs, severe market competition, etc.
Formula
Gross Profit Margin = Gross Profit / Net Sales
Where,
Gross Profit = Net Sales – Cost of Goods Sold
Net Sales = Total Sales – Discounts – Allowances – Sales Returns
Operating Profit Margin
Operating Profit Margin helps measure the company’s ability to maintain operating expenses to generate profit before interest expense and tax deduction. In other words, the remaining revenue after costs is deducted from net sales. A higher ratio indicates that the company is well equipped to pay its fixed costs and interest obligations, handle economic slowdowns, and offer lower prices than its competitors at lower margins. Moreover, the company management most frequently uses this to improve profitability by managing costs.
Formula
Operating Profit Margin Ratio = Operating Profit / Net Sales
Where,
Operating Profit = Gross Profit – Operating Expenses – Depreciation and Amortisation
Net Sales = Total Sales – Discounts – Allowances – Sales Returns
Net Profit Margin
The net profit margin measures the company’s overall profitability from its sales after deducting all direct and indirect expenses. Earnings per share (EPS) is another crucial metric for investors to assess a company’s profitability and stock valuation. Also, the percentage of revenue remains after deducting all expenses, interest, and taxes. A higher net profit shows that the company operates well while managing costs and pricing goods and services. However, one drawback of using this ratio is that it includes one-time expenses and gains, making it challenging to compare performance with that of its competitors.
Formula
Net Profit Margin Ratio = Net Income / Net Sales
Where,
Net Income = Gross Profit – All Expenses – Interest – Taxes
Net Sales = Total Sales – Discounts – Allowances – Sales Returns
Check Gross Margin vs Net Margin details here
Return on Equity (ROE)
ROE measures how well a company can use its shareholders’ money to generate profits. It quantifies a company’s financial performance and profitability on a per-share basis, which is crucial for investors assessing the attractiveness of a company’s stock. Also, it indicates the returns on the sum of money the investors have invested in the company. Furthermore, ROE is usually watched by investors and analysts. Moreover, a higher ROE ratio can be one of the reasons to buy a company’s stock. Companies with a high return on equity can generate cash internally; thus, they will be less dependent on debt financing.
Formula
Return on Equity = Net Profit after Taxes / Shareholder’s Equity x 100
Where,
Shareholder’s Equity = Equity Share Capital
Return on Assets (ROA)
Return on Assets (ROA) measures how well a company uses its assets to generate profits. In other words, it focuses on how much profit it generates for every rupee invested. It also measures the asset intensity of the company. Thus, a lower ROA indicates a more asset-intensive company. On the contrary, a higher ROA indicates more profitability against the company’s number of assets to operate. Moreover, companies with higher asset intensity must invest significantly in machinery and equipment to generate Income. For example – telecommunication, car manufacturers, railroads, etc.
Formula
Return on Assets = Net Profit after Taxes / Total Assets x 100
Where,
Total assets = All the assets on the balance sheet
Return on Capital Employed (ROCE)
Return on Capital Employed (ROCE) measures the company’s overall return against the overall investment of both shareholders and bondholders. This ratio is similar to ROE but is more comprehensive as it includes the returns generated from bondholders’ capital investments.
Formula
Return on Capital Employed (ROCE) = EBIT / Capital Employed
Where,
EBIT (Earnings Before Interest & Taxes) = Net Profit Before Interest and Taxes
Capital Employed = Total Assets – Current Liabilities
How to Calculate Profitability Ratios?
The profitability ratio is also a financial metric to measure if a company has a healthy profit margin. It involves the relationship of a company’s earning power and its financial metrics, such as the dividend payout ratio and the structure of the income statement. Also, you can calculate these ratios consistently and track the profitability over time. Let us understand how profitability ratios are calculated using the following example.
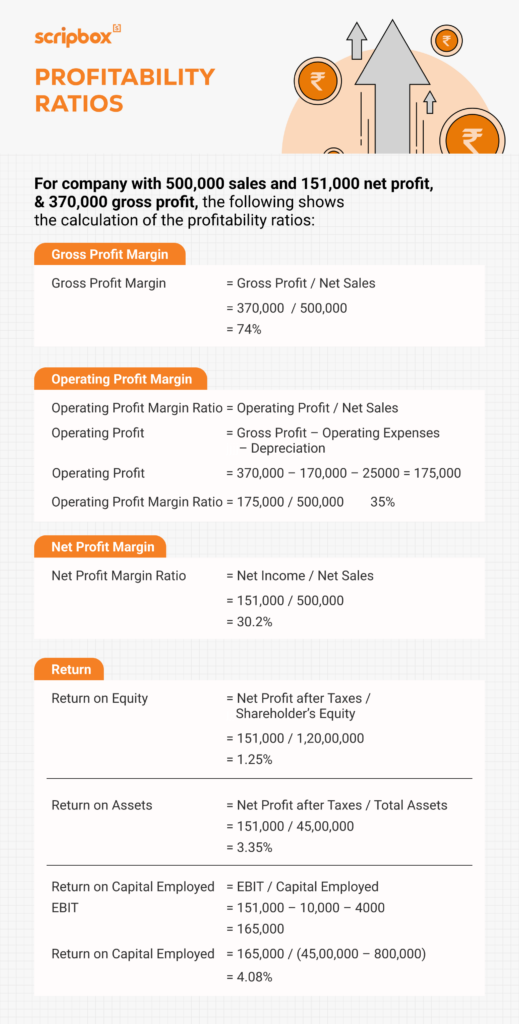
Company ABC ltd manufactures customized skates where the total equity capital is Rs 12 crores. At the end of the financial year, the total assets are Rs 45 lakhs and also current liabilities is Rs 8 lakhs, and the income statement looks like below –
| Particulars | Amount (Rs.) |
| Total Sales | 500,000 |
| Cost of Goods Sold | 130,000 |
| Gross Profit | 370,000 |
| Salary Expense | 10,000 |
| Operating Expenses | 170,000 |
| Interest | 10,000 |
| Depreciation | 25000 |
| Taxes | 4000 |
| Net Profit | 151,000 |
The following table shows the calculation of the profitability ratios:
Using the above ratios, you can analyse the company’s performance and also do a peer comparison. Furthermore, these ratios will help you evaluate if a company is worth investing in. Therefore, carefully consider all the profitability ratios and take informed decisions.
Recommended Read: What is Portfolio Turnover Ratio?
Interpreting Profitability Ratios
Interpreting profitability ratios requires a thorough understanding of the underlying financial data and the company’s industry. A higher ratio or value is generally considered better, but it’s essential to consider the industry average, competitors, and the company’s past performance. For example, a high gross profit margin may indicate a company’s ability to charge a premium for its products, while a low net profit margin may suggest inefficient operations or high costs.
When interpreting profitability ratios, it’s crucial to consider the following factors:
- Industry average: Compare the company’s ratios to the industry average to determine if it’s performing better or worse than its peers.
- Competitors: Analyze the ratios of competitors to identify areas of strength and weakness.
- Past performance: Compare the company’s current ratios to its past performance to identify trends and areas for improvement.
Economic conditions: Consider the overall economic conditions and how they may impact the company’s profitability.
Importance of Profitability Ratios
Profitability ratios are important because they show how well a company makes profits after paying all its costs. A profitability ratio is a key financial metric that indicates if a company can make regular profits and how well it uses investments to give returns to shareholders. By looking at profitability ratios, we can see how good the management is at running the company and understand the company’s overall financial health.
High or Low Gross Margin
A high gross margin means the company charges higher prices or keeps its direct costs low. This makes the company strong in the market. A low gross margin might mean weak pricing or high direct costs. Sometimes, changing the mix of products can also lower the gross margin.
If the gross margin is good but the operating margin is low, the company might spend too much on fixed costs like rent or employee salaries.
High or Low Net Margin
A company with a substantial net margin manages its operating and non-operating expenses well. A low net margin could be due to high interest payments on debt. Debt isn’t always bad if the interest rates are low and the company can handle the payments.
Comparing with Competitors
For small businesses, comparing revenue with bigger competitors might not help. Instead, profitability ratios show how efficient and profitable the company is compared to others.
Finding Problems in the Company
Reading financial statements, such as balance sheets and income statements, shows the big picture. However, determining profitability ratios can reveal specific problems, like rising costs of goods sold.
Understanding Seasonal Businesses
Companies whose sales change with the seasons can use profitability ratios to their advantage. Comparing performance over the same quarters in different years helps with budgeting and planning.
Attracting InvestorsInvestors study companies before investing. Profitability ratios give them the information they need to make wise decisions.
Using Profitability Ratios for Business Decision-Making
Profitability ratios are a powerful tool for business decision-making. By analyzing these ratios, companies can identify areas of strength and weakness, make informed decisions about investments, and develop strategies to improve profitability. Here are some ways profitability ratios can be used for business decision-making:
- Identifying areas for cost reduction: By analyzing the operating profit margin, companies can identify areas where costs can be reduced to improve profitability.
- Evaluating investment opportunities: By analyzing the return on investment (ROI) ratio, companies can determine the potential return on investment and make informed investment decisions.
- Developing pricing strategies: By analyzing the gross profit margin, companies can develop pricing strategies to maximize profitability.
- Improving operational efficiency: By analyzing the net profit margin, companies can identify areas where operational efficiency can be improved to increase profitability.
Conclusion
Profitability ratios are important tools that show how well a company makes money. They measure profits at different levels, like gross profit, profit after taxes (PAT), and EBITDA. By checking these ratios, companies can see how they do in areas like sales and cost management. Regularly reviewing them helps businesses find and fix problems.
Understanding and analyzing profitability ratios helps both managers and investors make smart decisions.


Show comments