
Share
Merely tracking the historical returns and fund ranking will not help you choose the right fund. You should understand the manager’s ability to generate benchmark-beating returns, asset allocation, risk management, and skill to manage the investment portfolio. Furthermore, it measures the risk-adjusted returns and performance against the benchmark. This article covers why and how you should analyze mutual fund performance and the critical mutual fund performance ratios.
Confused if your portfolio is performing right enough to meet your goals?

Understanding Mutual Fund Ratios: Ways to Measure Performance
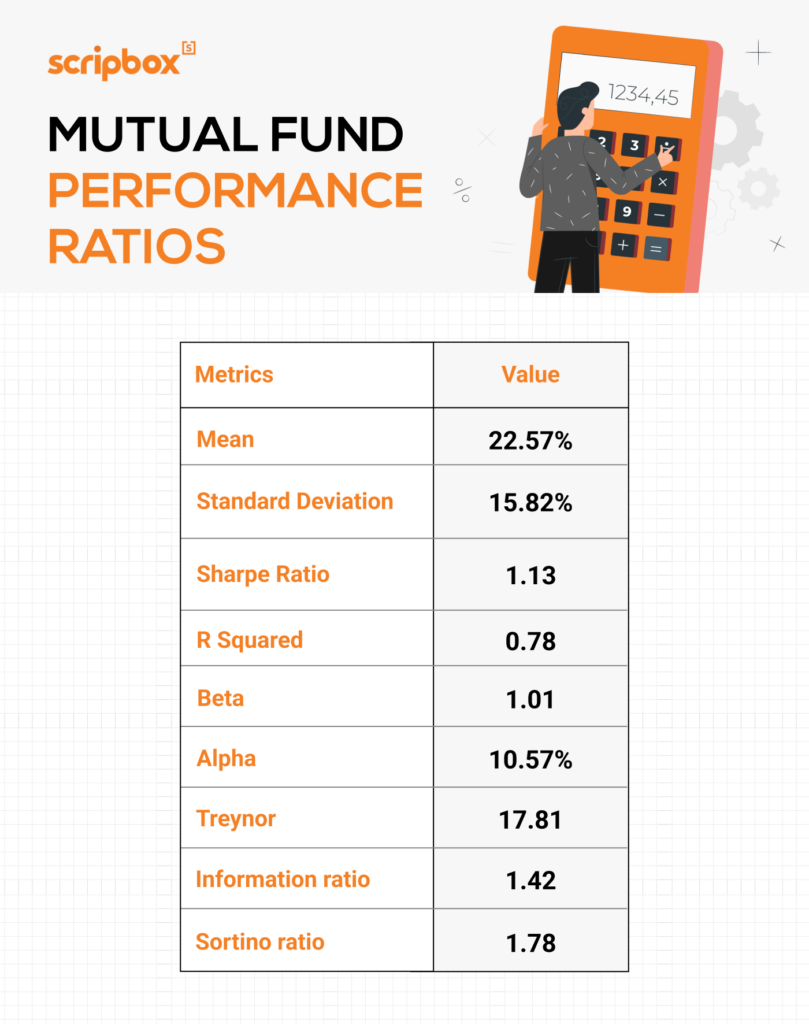
Multiple metrics help you analyze mutual funds. Evaluating a fund’s key metrics and ratios is crucial for understanding its performance and risk. Following are some of the most commonly used mutual fund performance ratios:
1. Understanding Performance Metrics
When evaluating a mutual fund, it’s essential to understand the various performance metrics used to assess its risk-adjusted returns. These metrics provide valuable insights into a fund’s historical performance, helping investors make informed decisions. In this section, we’ll delve into the key performance metrics used to evaluate mutual funds.
A mutual fund’s performance is often measured against its benchmark index, which serves as a reference point for evaluating its risk-adjusted returns. The Sharpe Ratio, a widely used metric, calculates the excess return of a fund over the risk-free rate, relative to its standard deviation. This metric helps investors understand the fund’s risk-adjusted performance and make comparisons with other investments.
Standard deviation, another crucial metric, measures the volatility or dispersion of a fund’s returns. A higher standard deviation indicates greater volatility, while a lower standard deviation suggests more stable returns. By analyzing a fund’s standard deviation, investors can gauge its risk level and potential for returns.
In addition to these metrics, investors should also consider a fund’s alpha, which represents its excess return over the benchmark index. A positive alpha indicates that the fund has outperformed its benchmark, while a negative alpha suggests underperformance. By evaluating a fund’s alpha, investors can assess the fund manager’s skill and ability to generate returns.
2. Alpha
Alpha determines how much return you can expect from your mutual fund investment. When you look at the Alpha value of a mutual fund, you can estimate how much return the fund can potentially generate. Although a higher Alpha number can signal higher returns, it isn’t the only indicator to use when evaluating a fund’s performance. The fund is performing well if its alpha is significantly higher than its benchmark.
A negative alpha indicates that the fund has underperformed its benchmark. On the other hand, positive alpha indicates outperformance relative to the benchmark, irrespective of the numeric value.
Alpha=(Mutual Fund Return−Risk-Free Return)−[Beta×(Benchmark Return−Risk-Free Return)].
3. Beta
Beta measures the sensitivity of a mutual fund towards dynamic market movements. It’s a metric that measures how volatile a mutual fund portfolio is compared to the overall market. Looking at a mutual fund’s beta, you can get a sense of how the fund responds to market fluctuations. The beta of a market or benchmark is always one. A beta of less than one suggests lesser volatility when compared to the benchmark index. A beta greater than one suggests a high level of volatility.
Beta = (Mutual Fund Return – Risk-Free Rate (Rf)) / (Benchmark Return – Risk-Free Rate (Rf))
The Risk-Free Rate (Rf) is the theoretical return on an investment with zero risk, often represented by government bonds, whereas the Benchmark Return is the percentage change in the value of a market index used to compare the fund’s performance.
You can decide whether or not to include a mutual fund in your investment portfolio based on its beta value. Risk-averse investors should ideally choose funds with a beta of less than 1, while risk-takers can pick funds with a high beta (greater than 1). However, beta can help you understand how risky a mutual fund is. It doesn’t give you any information about the fund’s inherent or absolute risk. Evaluating beta is crucial for assessing the risk of an investment.
3. Standard Deviation
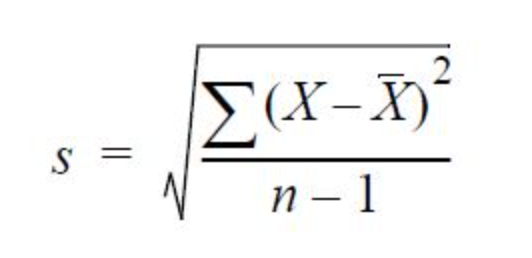
A standard deviation is a statistical measure of how much a portfolio’s returns deviate from its average. A mutual fund’s standard deviation reveals its volatility. It shows how far a mutual fund’s performance deviates from expected returns. A high standard deviation indicates a more comprehensive range of returns, whereas a lower value indicates a narrower range.
Standard deviation measures the total risk of the mutual fund rather than just the market-related volatility. As a result, it is a more comprehensive statistic than beta.
To use standard deviation as a performance ratio, compare two funds in the same category. In other words, you cannot determine if the standard deviation of a fund is high or low without comparing it to other funds in the same category.
4. Sharpe Ratio
Sharpe ratio is a performance metric that helps estimate a mutual fund’s risk-adjusted returns. Risk-adjusted returns are the returns a mutual fund generates over and above the risk-free rate of return. The higher the ratio, the better the investment return compared to the risk. A higher Sharpe ratio indicates better risk-adjusted returns, and a negative Sharpe ratio implies that the risk taken did not provide an adequate return.
The Sharpe ratio considers an investment’s inherent risk (standard deviation). As a result, it aids in determining a fund’s return-generating capacity for each unit of risk it absorbs.
Sharpe Ratio = (Mutual Fund Returns – Risk Free Rate) / Standard Deviation
Sharpe ratio is a quantitative metric that gives you a snapshot of the fund’s performance. It aids in the comparison of two funds. You can also analyze the fund’s risk to understand if it can generate returns than the risk-free rate.
5. Information Ratio
Information ratio compares the risk-adjusted returns of a mutual fund portfolio to its benchmark. The purpose of this ratio is to show excess returns relative to the benchmark, as well as the consistency with which excess returns are generated.
The information ratio is used to evaluate an asset manager’s trustworthiness, risk management expertise, and ability to outperform the benchmark. Using the information ratio, you can determine how successful a fund’s investment and allocation strategy is.
Information Ratio = (Portfolio Returns – Benchmark Returns)/ Tracking Error
The tracking error indicates how consistently the fund is able to generate excess returns over the benchmark. A low tracking error shows that the portfolio outperforms the benchmark on a consistent basis. The fund’s performance is highly volatile if the tracking error is high.
Additional Metrics for Evaluation
While the Sharpe Ratio and standard deviation are essential metrics for evaluating mutual funds, there are additional metrics that can provide further insights into a fund’s performance. In this section, we’ll explore these additional metrics and their significance in evaluating mutual funds.
Treynor Ratio
- What It Measures: The Treynor Ratio evaluates a mutual fund’s excess return (over the risk-free rate) relative to its systematic risk, represented by beta. It helps measure how well a fund compensates investors for the market risk taken.
- Why It’s Useful:
- Helps investors compare funds based on their risk-adjusted performance.
- Particularly beneficial for funds with high beta values (higher sensitivity to market movements), as it accounts for systematic risk, not total risk.
- Formula: Treynor Ratio=Fund Return−Risk-Free Rate (Rf)Beta\text{Treynor Ratio} = \frac{\text{Fund Return} – \text{Risk-Free Rate (Rf)}}{\text{Beta}}Treynor Ratio=BetaFund Return−Risk-Free Rate (Rf)
Sortino Ratio
What It Measures: The Sortino Ratio focuses on downside risk (negative volatility) instead of total risk. It evaluates a fund’s risk-adjusted return relative to its downside deviations, providing insight into how well the fund avoids losses.
Why It’s Useful:
Especially valuable for risk-averse investors who prioritize minimizing losses over maximizing returns.
Highlights a fund’s ability to generate returns without exposing investors to excessive downside risk.
Formula: Sortino Ratio=Fund Return−Risk-Free Rate (Rf)Downside Deviation\text{Sortino Ratio} = \frac{\text{Fund Return} – \text{Risk-Free Rate (Rf)}}{\text{Downside Deviation}}Sortino Ratio=Downside DeviationFund Return−Risk-Free Rate (Rf)
Downside Deviation: Measures only the volatility of returns below a minimum acceptable return (MAR), typically the risk-free rate or 0%.
Information Ratio (IR)
What It Measures: The Information Ratio evaluates a fund’s excess return (returns over its benchmark) relative to the fund’s tracking error (how much it deviates from the benchmark).
Why It’s Useful:
Assesses a fund manager’s skill in generating consistent, benchmark-beating returns while keeping deviations (or risks) low.
Useful for actively managed funds aiming to outperform their benchmarks.
Formula:
Information Ratio=Fund Return−Benchmark ReturnTracking Error
Information Ratio=Tracking ErrorFund Return−Benchmark Return
Tracking Error: The standard deviation of the difference between the fund’s and the benchmark’s returns.
Key Takeaway: A higher Information Ratio indicates a fund manager’s ability to consistently outperform the benchmark with controlled risk.
R-Squared (R²)
What It Measures: R-Squared measures the proportion (%) of a fund’s returns that can be explained by movements in its benchmark index. It shows how closely a fund correlates with its benchmark.
Why It’s Useful:
Helps investors understand if a fund is highly dependent on the benchmark’s performance.
A high R-Squared (close to 100%) indicates that the fund’s performance is closely tied to the benchmark, while a low R-Squared indicates more independent performance.
Formula:
R-Squared=(Correlation (r)21)×100
R-Squared=(1Correlation (r)2)×100
Derived from the square of the correlation (r) between the fund’s returns and the benchmark’s returns.
By considering these additional metrics, investors can gain a more comprehensive understanding of a mutual fund’s performance and make informed decisions about their investments.
Why Should You Analyze the Performance of Mutual Funds?
Mutual funds, especially equity ones, are not fixed-income investments. They are linked to market performance and come with risks, which is why you hear the disclaimer, “Mutual fund investments are subject to market risks.” Their value can rise and fall with market conditions.
Since past performance doesn’t guarantee future results, you shouldn’t rely solely on a mutual fund’s past performance.
After investing, you need to analyze your mutual fund performance regularly. Markets are volatile, and a fund’s performance can change. Monitoring your investments helps keep your goals on track and ensures your asset allocation remains appropriate.
Changing market conditions might cause a fund to underperform your expectations. Therefore, it is crucial to monitor how the fund is performing relative to market conditions.
Events like a new fund manager, changes in the fund’s investment objectives, or continuous underperformance compared to the benchmark are signals to watch the fund’s performance closely.
These changes might not align with your investment goals, so it’s important to review and possibly rebalance your investments.
How Often Should You Analyze Mutual Fund Performance?
Checking your investments daily or with every market fluctuation is not helpful. Long-term investments are more likely to yield significant returns. Analyzing your mutual fund performance every six months to a year is advisable. Annual reviews provide a better understanding of the fund’s performance.
Actively managed funds require time and patience. Equity funds can be volatile in the short term but may offer substantial growth over the long term. If you have thematic or sector-specific funds, you should review them more often due to their sensitivity to market changes.
Monitor funds that underperform their benchmarks. Observe these funds for a few quarters before deciding to exit. Prolonged underperformance could be a sign to avoid that particular fund as the recovery can be quite hard.
Additionally, Fund managers frequently adjust the portfolio, affecting risk levels. If a fund becomes riskier without better returns, it might be wise to exit. Consider the fund’s risk-adjusted return—a measure of how much return an investment generates relative to the risk taken.
Remember, funds performing well now may only continue to do so in the present. Regularly reviewing your portfolio helps you make informed decisions to achieve your financial goals.
Importance of Mutual Fund Ratios
Mutual fund ratios are important because they give you key insights into a fund’s performance, costs, and risk level.
- Understanding Costs: Expense Ratio
The expense ratio shows how much it costs to manage and operate the mutual fund. - Balancing Risk and Reward: Sharpe Ratio
The Sharpe ratio in mutual funds helps you see how well a fund performs compared to the risk it takes. - Outperforming the Benchmark: Alpha
Alpha measures how well a fund does compared to its benchmark. A positive alpha means that the fund manager adds value by outperforming the market, guiding you toward skillfully managed funds. - Measuring Volatility: Beta
Beta tells you how much a fund’s value might change compared to the market. - Tracking the Benchmark: R-Squared
R-squared shows how closely a fund’s performance follows its benchmark index. - Understanding Fluctuations: Standard Deviation
Standard deviation measures how much a fund’s returns might vary over time. A higher standard deviation means more fluctuations.
Scripbox Mutual Fund Research Tools
- Compare Mutual Fund
- Latest Nav
- Mutual Fund Ratings
- List of Mutual Funds ISIN
- Mutual Fund Returns Calculator
- What is Portfolio Turnover Ratio?


Show comments