
Share
Analyzing any financial ratio is crucial for a company’s fundamental analysis. Financial ratios show different aspects of an organization’s profitability and cost efficiency. Different types of ratios help measure the company’s profitability against revenue over time. They are expressed in percentage form. This article will discuss the gross profit ratio and its calculation and interpretation.
What is Gross Profit Ratio?
Gross Profit Margin Ratio, sometimes referred to as gross margin, is a type of profitability ratio. After deducting the direct costs, it helps to measure how much profit a company makes from selling goods and services. In other words, measuring a company’s profitability is a simple metric. It also helps to evaluate how efficiently the company uses its labor and raw materials during production.
A company’s income statement calculates gross profit after deducting the cost of goods sold from the total sales. The cost of goods sold considers only the company’s direct costs, not indirect costs. The direct costs are variable as they change with the quantity of production. Examples of direct costs are direct labor and direct materials.
The gross profit margin ratio may vary for the company and industry. The higher the profit margin, the more efficient the company. Also, this ratio gives owners a picture of how production costs affect their revenue. If the gross margin depreciates, they may revisit their strategy, change cash flow projections, change pricing, cut costs, use cheaper raw materials, etc.
Learn: Golden Rules of Accounting
Confused if your portfolio is performing right enough to meet your goals?

Definition and Explanation
The Gross Profit Ratio is a financial metric that measures a company’s profitability by expressing its gross profit as a percentage of its total sales. It is a key indicator of a company’s ability to generate profit from its sales, and it helps in knowing the profit that a company makes after deducting the direct costs and expenses. The Gross Profit Ratio is a useful tool for investors and business owners to analyze a company’s financial performance and make informed decisions.
Gross Profit Ratio Formula
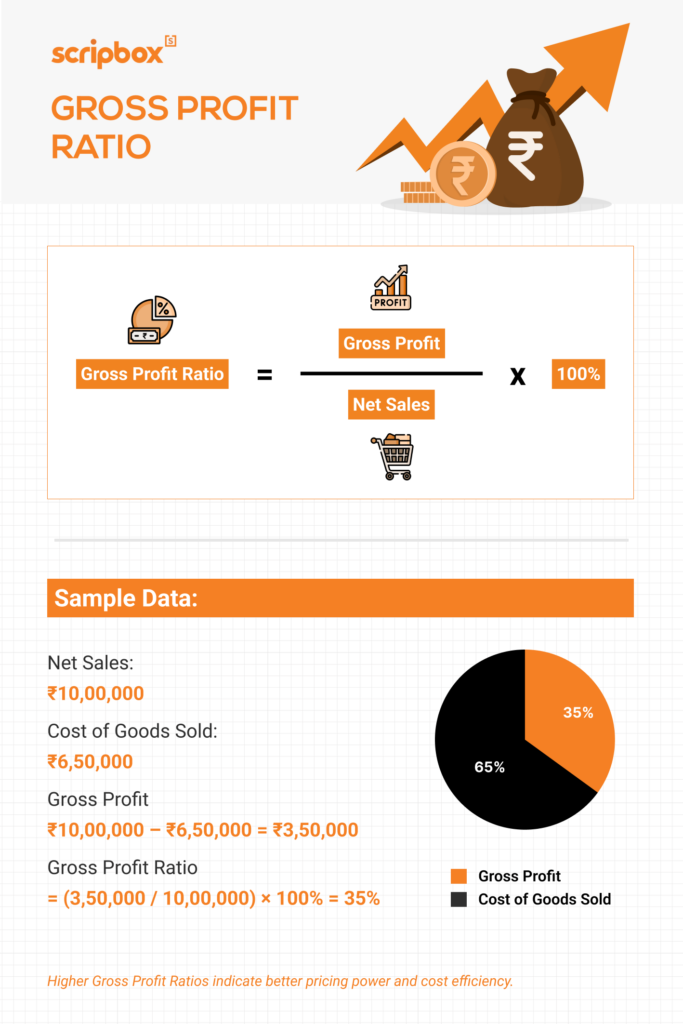
The gross profit margin is the percentage of revenue that remains after the cost of goods sold. The following is the formula to calculate –
Gross Profit Margin = (Net Sales – Cost of Goods Sold)/ Net Sales
To calculate the gross profit, subtract the cost of goods sold (COGS) from net sales.
Where
- Net Sales deducting any sales returns, discounts, or allowances from the total sales. Net sales give more accurate information than total sales.
- The cost of Goods Sold (COGS) includes direct costs during production, such as direct materials and labor. These costs may vary depending on the company and industry. Indirect costs and other fixed costs, such as administrative expenses and marketing expenses, are not included in COGS.
Calculation
Let’s assume that company ABC has Rs. 75 lakhs in net sales and a cost of goods sold of Rs. 35 lakhs per the income statement. To calculate the gross profit and gross profit margin, subtract the cost of goods sold from net sales and then divide by net sales.
What is the gross profit margin?
Gross Profit Ratio = (75,00,000 – 35,00,000)/ 75,00,000
= 0.5333 or 53.33%
Therefore, the company earned 53% gross profit from its previous total sales. This profit is used to cover operating expenses and other costs.
Explore: Portfolio Turnover Ratio
Interpretation of Gross Profit Margin Ratio
The Gross Profit Margin Ratio measures how a company profits from its products and services. The following is the interpretation of this ratio.
Efficiency in Production Process
This ratio helps measure the company’s efficiency in producing a profit after the production and sales process. The company aims to generate a higher gross profit margin. A higher ratio indicates that the company is making more efficient. Simply, it suggests that the company has efficient management, low-cost production, and increased sales prices. However, the stock evaluation is not considered as this does not indicate the business’s efficiency. Any significant changes in this ratio can sometimes indicate poor company management. However, there can be other reasons for fluctuations, such as temporary manufacturing issues resulting in lower product quality.
Conversely, a low ratio indicates that the company is not producing efficiently. It requires careful, in-depth analysis. Some of the reasons can be a higher cost of production, a decline in sales price, poor pricing strategy, or any change in sales mix. Thus, the company must watch out and avoid a lower ratio situation, as it can lead to losses.
Importance of Gross Profit Margin Ratio
The Gross Profit Ratio (GP Ratio) is a key metric for evaluating a company’s financial performance. Here’s why it matters:
- Profitability Analysis: It shows how efficiently a company generates profits from sales. A higher gross profit ratio signals strong financial health and profitability.
- Cost Management: It helps track whether production costs are rising faster than sales. Companies can use it to identify the need for cost-cutting measures.
- Pricing Strategy: Guides pricing decisions by showing whether prices can be adjusted to boost profits without losing customers.
- Investment Analysis: Investors use the GP ratio to assess a company’s profitability and stability. A steady or growing ratio is a positive sign for potential investments.
- Benchmarking: Enables companies to compare their performance against industry standards and identify areas for improvement.
- Budgeting and Forecasting: Historical gross profit ratios help set financial targets and predict future performance.
- Resource Allocation: Companies with higher ratios can allocate more funds to growth activities, like R&D and marketing.
- Financial Planning: The ratio helps make informed decisions about scaling production or launching new products.
- Credit Analysis: Creditors and lenders assess a business’s creditworthiness using the gross profit ratio. A higher ratio indicates lower default risk.
- Operational Efficiency: A consistent GP ratio reflects effective cost control and streamlined operations, ensuring sustainable growth.
Thus, a gross profit margin plays a vital role in understanding the company’s management and shows how much more the company has to cover operating financing and other costs. Also, it is essential to keep this ratio stable, and any significant change requires action immediately.
High Gross Profit Ratio
A higher ratio is usually a positive sign and could mean:
- Better Profitability: The company keeps a larger share of its revenue as profit, showing strong financial performance.
- Efficient Cost Management: It’s likely controlling production or service costs well, leading to healthier margins.
- Smart Pricing: The company might have nailed its pricing strategy, charging higher prices without significantly rising costs.
- Competitive Edge: This could mean that the company offers unique products or services that allow it to maintain higher margins than competitors.
- Investment Potential: With more profits, the company has extra resources to invest in growth areas like R&D or marketing.
Low Gross Profit Ratio
A lower ratio isn’t always bad but often signals challenges:
- Lower Profitability: The company is keeping less revenue as profit, which could hurt overall financial health.
- Higher Costs: Rising production or service costs might affect profits.
- Pricing Challenges: It may be pressured to lower prices to compete, which cuts its margins.
- Strategic Choice: Sometimes, a low ratio is intentional for example, offering lower prices to attract more customers and gain market share.
- Financial Strain: If the low ratio persists, it could indicate financial trouble or difficulty covering operating expenses.
- Limited Growth Resources: With lower profits, the company may struggle to fund expansion or new opportunities.
Difference Between Gross Profit Ratio and Net Profit Ratio Formula
The gross and net profit ratios are key financial metrics, but they focus on different aspects of a company’s profitability. Here’s how they differ:
The gross profit ratio formula is calculated as: (Gross Profit / Revenue) × 100%
It considers only revenue and the cost of goods sold (COGS), highlighting profitability after accounting for direct production costs. This ratio helps analyze how efficiently a company produces and prices its goods or services. A higher gross profit ratio signals efficient production processes and pricing strategies, making it useful for comparing companies within the same industry.
The net profit ratio formula is calculated as: (Net Profit / Revenue) × 100%
It factors in all expenses, including COGS, operating costs, taxes, and interest, to show the overall profitability of the business. This ratio evaluates how well the company manages its total expenses relative to its revenue. A higher net profit ratio indicates efficient management of production costs, operational expenses, and taxes, making it ideal for comparing companies across industries.
Limitations and Considerations
While the Gross Profit Ratio is a useful metric, it has some limitations and considerations. For example, it does not take into account other expenses such as operating expenses, taxes, and interest payments. Additionally, the Gross Profit Ratio can be affected by changes in the cost of goods sold, which can be influenced by factors such as inflation, supply chain disruptions, and changes in market demand. Therefore, it is important to consider these limitations and use the Gross Profit Ratio in conjunction with other financial metrics to get a comprehensive view of a company’s financial performance.
Strategic Decision-Making
The Gross Profit Ratio can be used to inform strategic decision-making in a company. For example, a company with a high Gross Profit Ratio may consider expanding its product line or increasing its marketing efforts to capitalize on its profitability. On the other hand, a company with a low Gross Profit Ratio may need to focus on reducing its costs or improving its pricing strategy to improve its profitability. By analyzing the Gross Profit Ratio, companies can identify areas for improvement and make informed decisions to drive growth and profitability.
Industry Benchmarking
The Gross Profit Ratio can also be used for industry benchmarking, which involves comparing a company’s financial performance to that of its peers in the same industry. By comparing the Gross Profit Ratio of different companies in the same industry, investors and business owners can gain insights into the relative profitability of each company and identify areas for improvement. Industry benchmarking can also help companies to identify best practices and strategies that can be adopted to improve their financial performance.
Conclusion
In conclusion, the Gross Profit Ratio is a useful financial metric that can provide valuable insights into a company’s profitability and financial performance. By understanding the definition and explanation of the Gross Profit Ratio, its limitations and considerations, and its use in strategic decision-making and industry benchmarking, investors and business owners can make informed decisions to drive growth and profitability.
Also Read


- What is Gross Profit Ratio?
- Definition and Explanation
- Gross Profit Ratio Formula
- Interpretation of Gross Profit Margin Ratio
- High Gross Profit Ratio
- Low Gross Profit Ratio
- Difference Between Gross Profit Ratio and Net Profit Ratio Formula
- Limitations and Considerations
- Strategic Decision-Making
- Industry Benchmarking
- Conclusion


Show comments