

The Indian Equity market was in a state of consolidation in the calendar year 2016. The Benchmark Index – Nifty returned 2.61% for the year in comparison to the 5.19% of the Scripbox Equity Funds portfolio.
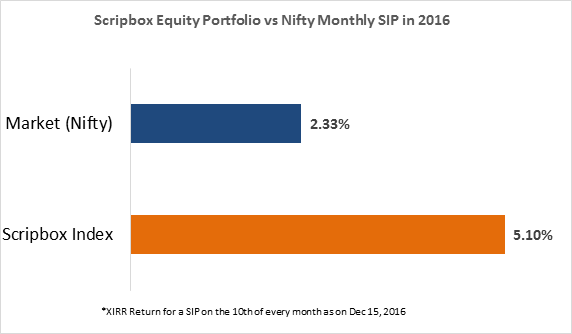
For our regular SIP investors, a monthly SIP in Scripbox recommended portfolio would have returned 5.10% this year, against 2.33% for a SIP in the Nifty. On the other hand, the Scripbox Index lagged some of the larger mutual funds, as some of the mid-cap oriented funds did better than the large-cap oriented funds during the year.
Overall, we believe that the equities continue to be the best option among investable assets and we are quite confident entering 2017.
1. The core idea of Scripbox :
The objective of the Scripbox portfolio of equity funds is to select a portfolio of 4 Diversified Equity funds that have a consistent track record of performing better than the Nifty, and therefore expected to do better than the Nifty.
We had the following 4 diversified equity funds in the 2016 portfolio of equity funds. This report card is based on the performance of these funds from January 1, 2016 till December 15, 2016.
- SBI BlueChip Fund (G)
- ICICI Pru Value Discovery Fund (G)
- Kotak Select Focus Fund (G)
- UTI-Equity Fund (G)
The analysis of the absolute performance of the Scripbox equity portfolio is a combination of the performance of the Nifty, and the performance of the portfolio relative to the Nifty.
2. Nifty Performance:
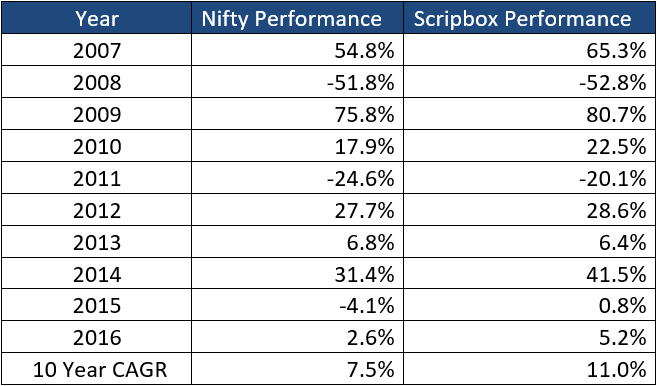
- In 2016, the Nifty provided return of 2.61% (till Dec 15, 2016)
- Over the last decade, the Nifty has returned a CAGR of 7.47%.
- We continue to believe that the case of Indian equities remains strong and equities as an asset class will continue to outperform fixed income over the long run.
Note: Till December 15, 2016
These are returns based on a one-time investment, for returns for a SIP investor, kindly refer section 6 below.
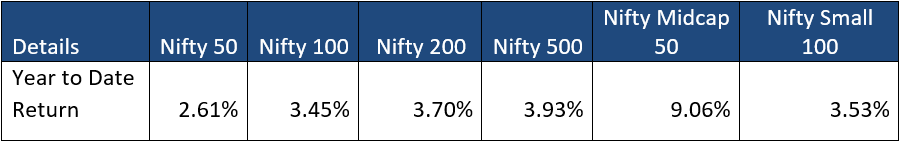
3. Nifty Relative to Other Benchmarks
In 2016, most benchmark Indices gave returns between 2.60% to 4.00% except Midcap Index which gave a return of 9.06%.
4. Scripbox Portfolio of Equity Funds
Three funds in the Scripbox portfolio outperformed the benchmark index and the UTI-Equity Fund(G) underperformed.
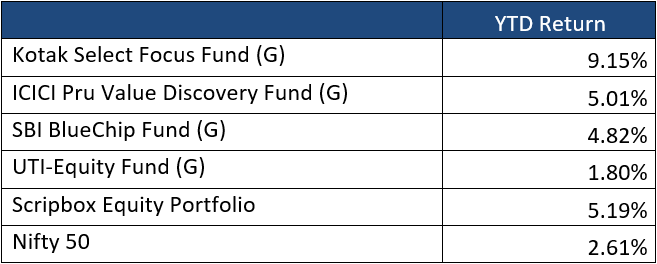
5. Scripbox Portfolio compared to other funds:
The top 25 funds by assets delivered an average return of 5.14% in the current year and the Scripbox portfolio performed in line at 5.19%
6. Returns for SIP investors
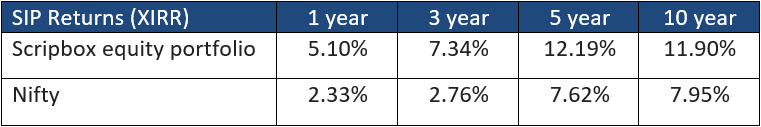
Assuming a SIP was made on the 10th of each month, the XIRR returns for a SIP investor would be 5.10% in the Scripbox portfolio of equity funds, compared with 2.33% in the Nifty in 2016.
The SIP outperformance of 2.77% was slightly higher than the absolute outperformance.
This is in line with the track record of Scripbox equity portfolio over the long-term. SIP returns in the Scripbox equity portfolio have been better than the Nifty over all holding periods.
This annual performance is similar to the annual performance in 2015 and in the years prior to that. You can read last year’s report card here.


Show comments