
The Indian Equity market was a mixed bag in 2018-19 (till March 31, 2019) with the key indices providing widespread returns. Though the Nifty was up 16.5% for the year, the Nifty Midcap 100 was down 1.9% and the Nifty Small Cap 250 was down 12.4% for the year. This shows a wide divergence of performance between the Large, Mid and Small cap Indices in this year. In comparison, the Scripbox ELSS portfolio was up by 3.97% resulting in an underperformance over Nifty 50 TRI.
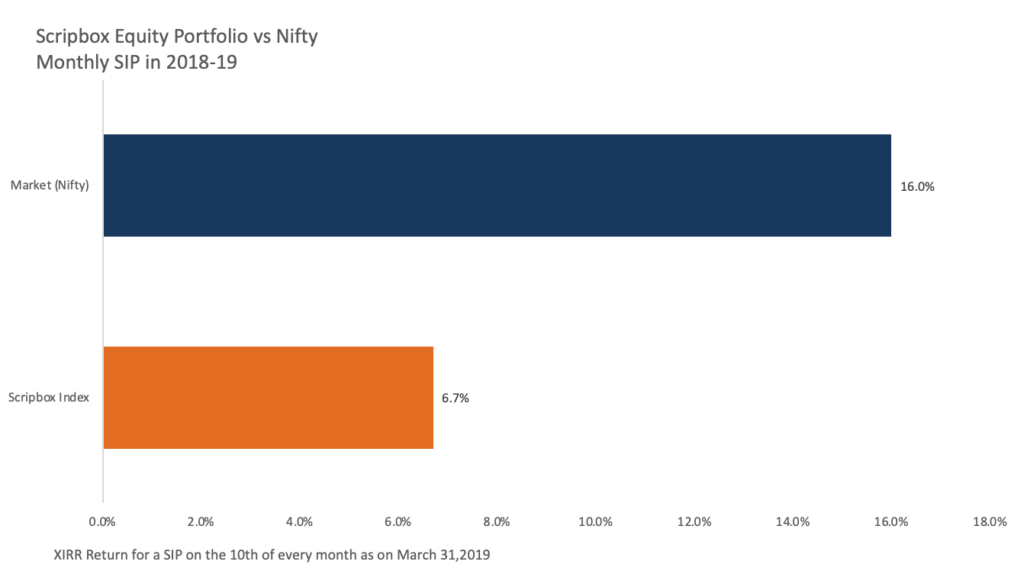
For our regular SIP (Systematic Investment Plan) investors, a monthly SIP in Scripbox recommended portfolio would have returned 6.7% this year against 16% for a SIP in the Nifty 50 TRI. Also, the Scripbox Index lagged some of the larger mutual funds, as some of the mid and small cap oriented funds did better than the large-cap oriented funds during the financial year.
Overall, we believe that the equities continue to be the best option among investable assets and we are quite confident entering 2019-20.
1. The core idea of Scripbox
The objective of the Scripbox portfolio of ELSS equity funds is to select a portfolio of 2 Tax Planning funds that have a consistent track record of performing better than the Nifty 50 TRI*, and therefore expected to do better than the Nifty 50 TRI*.
We had the following 2 funds in the financial year 2019 portfolio. This Report card is based on the performance of these funds from April 1, 2018 till Mar 31, 2019.
- DSP BR Tax Saver Fund (G)
- L&T Tax Advantage Fund (G)
The analysis of the absolute performance of the Scripbox ELSS equity portfolio is a combination of the performance of the Nifty 50 TRI, and the performance of the portfolio relative to the Nifty 50 TRI.
2. Nifty Performance
- In 2018-19, the Nifty was up 16.45%
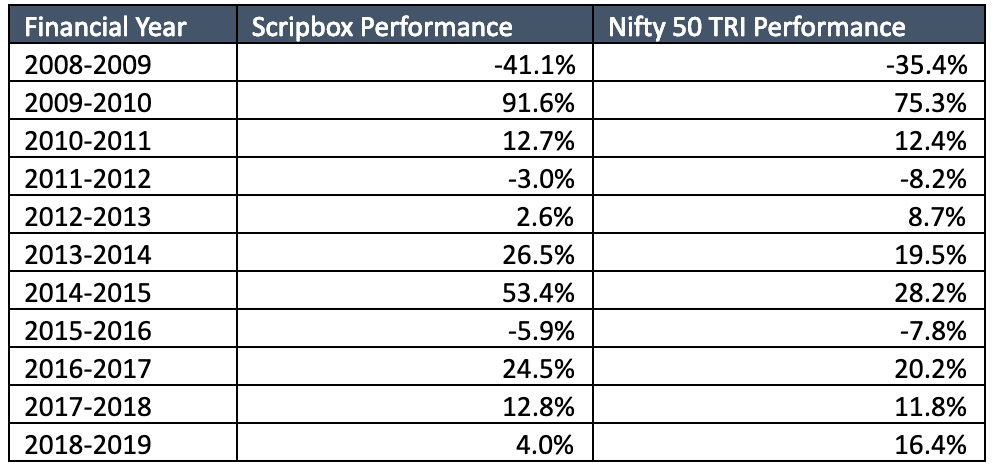
- Over a decade, the Nifty has returned a CAGR of 15.80%.
- We continue to believe that the case of Indian equities remains strong and equities as an asset class will continue to outperform fixed income over the long run.
These are returns based on a one-time investment. For returns for a SIP investor, kindly refer section 6 below.
3. Nifty 50 Relative to Other Benchmarks
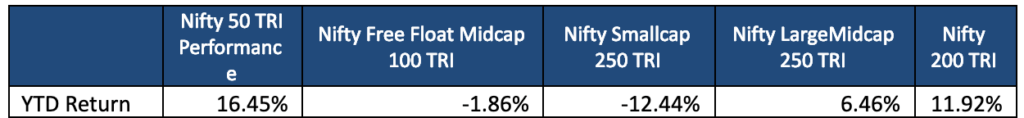
In FY 2019, most benchmarks including the mid cap and small cap indices provided mixed returns. Small cap significantly under performed Nifty 50 TRI
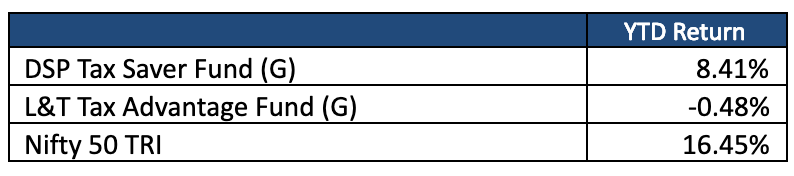
4. Scripbox Portfolio of ELSS Equity Funds
Both DSP BR Tax Saver Fund(G) and L&T Tax Advantage Fund (G) have underperformed the Nifty 50 TRI
5. Scripbox Portfolio compared to other funds
The top 10 funds by assets, delivered an average return of 5.6% in FY 19
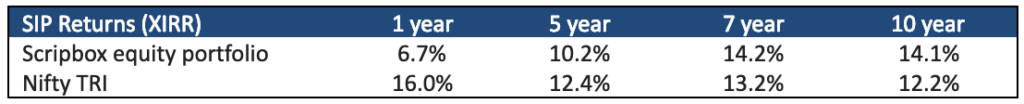
6. Returns for SIP investors
Assuming a SIP on the 10th of each month, the XIRR returns for a SIP investor was 6.7% in the Scripbox portfolio of ELSS funds, compared with 16.0% in the Nifty 50 TRI.
SIP returns in the Scripbox ELSS funds:
Above Scripbox report card considers Nifty 50 TRI as its benchmark for the purpose of comparison. This is as per SEBI’s circular dated Jan 04 2018 which required all the mutual funds to benchmark their performance against Total Returns Index (TRI) instead of Price Return Index (PRI).
*In line with the spirit of above circular, Scripbox Report Card will consider Nifty Large Mid 250 TRI as a benchmark for comparison from next year onwards. Nifty Large Mid 250 TRI is considered to be the appropriate benchmark for ELSS category of funds based on objective and portfolio composition of most funds in this category.


Show comments