
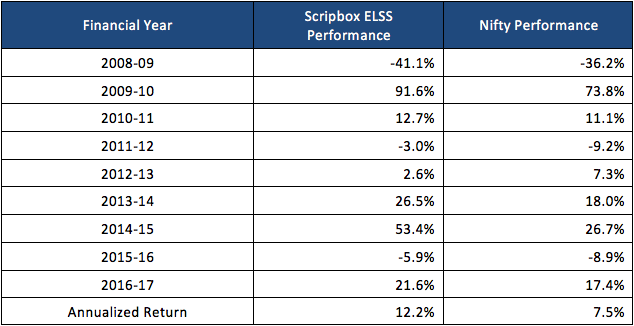
After negative return in FY 16, the Indian Equity Market bounced back and the Nifty 50 was up 17.40% on a Year to Date Basis in FY 17. In comparison, the Scripbox ELSS portfolio was up by 21.58% resulting in an outperformance of 4.18% over the benchmark index. This out-performance is in line with the historical average out-performance of the Scripbox portfolio over the Nifty 50.
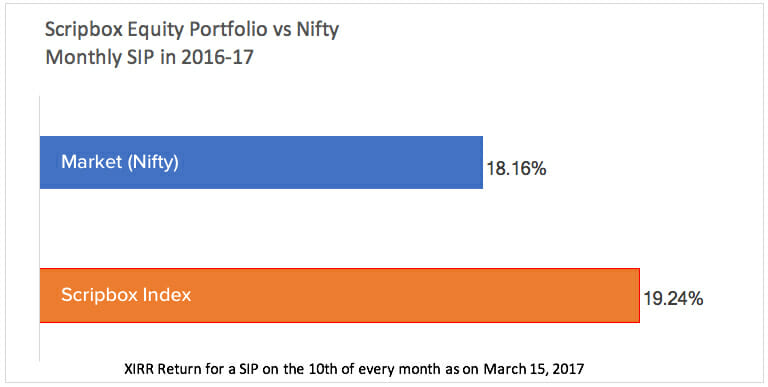
For our regular SIP (Systematic Investment Plan) investors, a monthly SIP in Scripbox recommended portfolio would have returned 19.24% this year against 18.16% for a SIP in the Nifty 50.
Overall, we believe that the equities continue to be the best option amongst investable assets and we are quite confident entering 2017-18.
1. The core idea of Scripbox :
The objective of the Scripbox portfolio of ELSS equity funds is to select a portfolio of 2 Tax Planning funds that have a consistent track record of performing better than the Nifty 50, and therefore expected to do better than the Nifty 50.
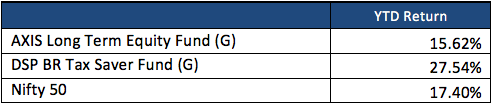
We had the following 2 funds in the financial year 2017 portfolio. This Report card is based on the performance of these funds from April 1, 2016 till Mar 15, 2017.
- Axis Long Term Equity Fund (G)
- DSP Black Rock Tax Saver Fund (G)
The analysis of the absolute performance of the Scripbox ELSS equity portfolio is a combination of the performance of the Nifty 50, and the performance of the portfolio relative to the Nifty 50.
2. Nifty Performance :
- In 2016-17, the Nifty was up 17.40% (up till March 15, 2017)
- Over a decade, the Nifty has returned a CAGR of 9.08%.
- We continue to believe that the case of Indian equities remains strong and equities as an asset class will continue to outperform fixed income over the long run.
These are returns based on a one-time investment, for returns for a SIP investor, kindly refer section 6 below.
3. Nifty 50 Relative to Other Benchmarks
In FY 2017, most benchmarks including the mid cap and small cap indices delivered good returns, there was some relative outperformance of the mid and small caps over the benchmark large cap index.

4. Scripbox Portfolio of ELSS Equity Funds:
DSP BR Tax Saver Fund(G) outperformed the Nifty 50 by 10.15%; Axis Long Term Equity Fund(G) underperformed the Nifty 50 by 1.78%.
5. Scripbox Portfolio compared to other funds:
The top 10 funds by assets, delivered an average return of 22.88% in FY 17 and the Scripbox portfolio performed in line at 21.58%, compared with 17.40% for the Nifty 50.
6. Returns for SIP investors
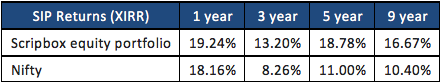
Assuming a SIP on the 10th of each month, the XIRR returns for a SIP investor was 19.24% in the Scripbox portfolio of ELSS funds, compared with 18.16% in the Nifty 50.
SIP returns in the Scripbox ELSS equity portfolio have been better than the Nifty 50 over all holding periods except in the last financial year.


Show comments