
The Nifty had a strong year, up 30.4% for the year and the Scripbox equity portfolio did better than the Nifty, up 39.3%. This out performance, at 8.9%, is much better than the historical average out performance of the Scripbox Portfolio(over the Nifty) of 4.2%.
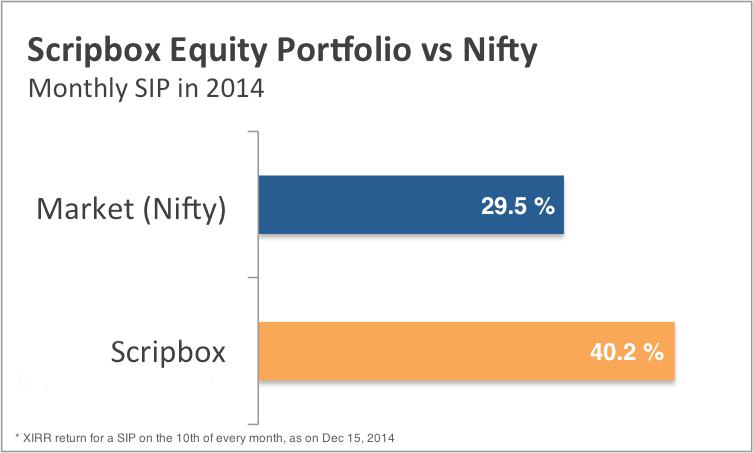
For our regular SIP investors, a monthly SIP in Scripbox recommended portfolio would have returned 40.2% this year against 29.5% for a SIP in the Nifty. On the other hand, the Scripbox Index lagged some of the larger mutual funds, as mid-cap stocks did much better than the large-caps during the year.
On the whole, we are satisfied with the overall performance of the Scripbox equity portfolio, and feel confident going into 2015.
The core idea of Scripbox :
The objective of the Scripbox portfolio of equity funds is to select a portfolio of 4 Diversified Equity funds that have a consistent track record of performing better than the Nifty, and therefore expected to do better than the Nifty.
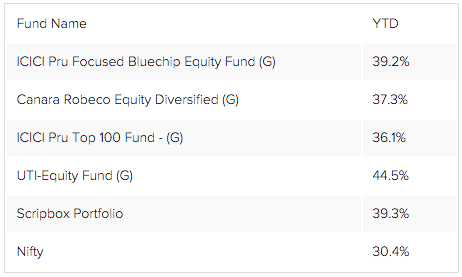
We had the following 4 diversified equity funds in the 2014 portfolio of equity funds. This Report card is based on the performance of these funds from Jan 1, 2014 till Dec 15, 2014.
- ICICI Pru Focussed Bluechip Equity Fund
- Canara Robeco Equity Diversified
- ICICI Pru Top 100
- UTI-Equity Fund
The analysis of the absolute performance of the Scripbox equity portfolio is a combination of the performance of the Nifty, and the performance of the portfolio relative to the Nifty.
Confused if your portfolio is performing right enough to meet your goals?

Nifty Performance :
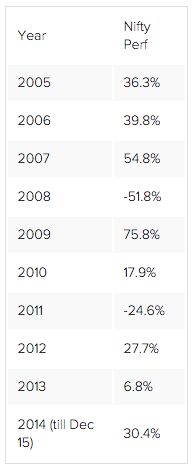
- Nifty was up 30.4% this year (till Dec 15, 2014)
- This has been a good performance, and the best since 2009. Note that 2009 was on a weak year prior to that.
- Over the past decade, the Nifty has delivered a CAGR return of 14.7% pa.
- On the whole, the hypothesis that equity markets should deliver better returns than debt and in line with nominal GDP growth continues to remain true.
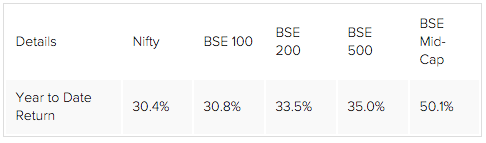
Nifty relative to other benchmarks :
- In the current year, the smaller and Mid-Cap stocks did better than the larger stocks.
- As a result, the benchmark indices that have a large representation of smaller and Mid-Cap stocks did better than the Nifty
Scripbox portfolio of equity funds :
- The Scripbox portfolio of equity funds was ahead of the Nifty by 8.9% for the year, delivering 39.3% return for the year.
- All 4 funds did better than the Nifty.
- UTI – Equity Fund was the best performing, with a 44.5% performance for the year.
Portfolio funds compared with other funds :
- The Top 25 funds, by size of assets managed, delivered an average performance of 46.1% in the current year.
- The Scripbox portfolio of funds under performed the average of the Top 25 funds, as the funds focused on Mid-Cap did much better than the large caps
Returns for SIP investors
Typically we have seen that SIP investors tend to be more stable than one time investors. The trend continues to be true in the current year.
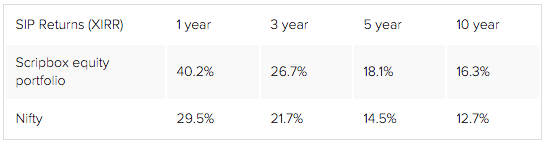
- Assuming a SIP on the 10th of each month, the XIRR returns for a SIP investor was 40.2% in the Scripbox portfolio of equity funds, compared with 29.53% in the Nifty.
- The SIP out performance of 10.67% was slightly higher than the absolute out performance.
- This is in line with the track record of Scripbox equity portfolio over the long term. SIP returns in the Scripbox equity portfolio have been better than the Nifty over all holding periods.
*Returns and growth are modeled on long term historical averages. Past performance is not an indicator of future returns.


Show comments