Scripbox Long Term Portfolio: Higher returns than benchmark with strong downside protection
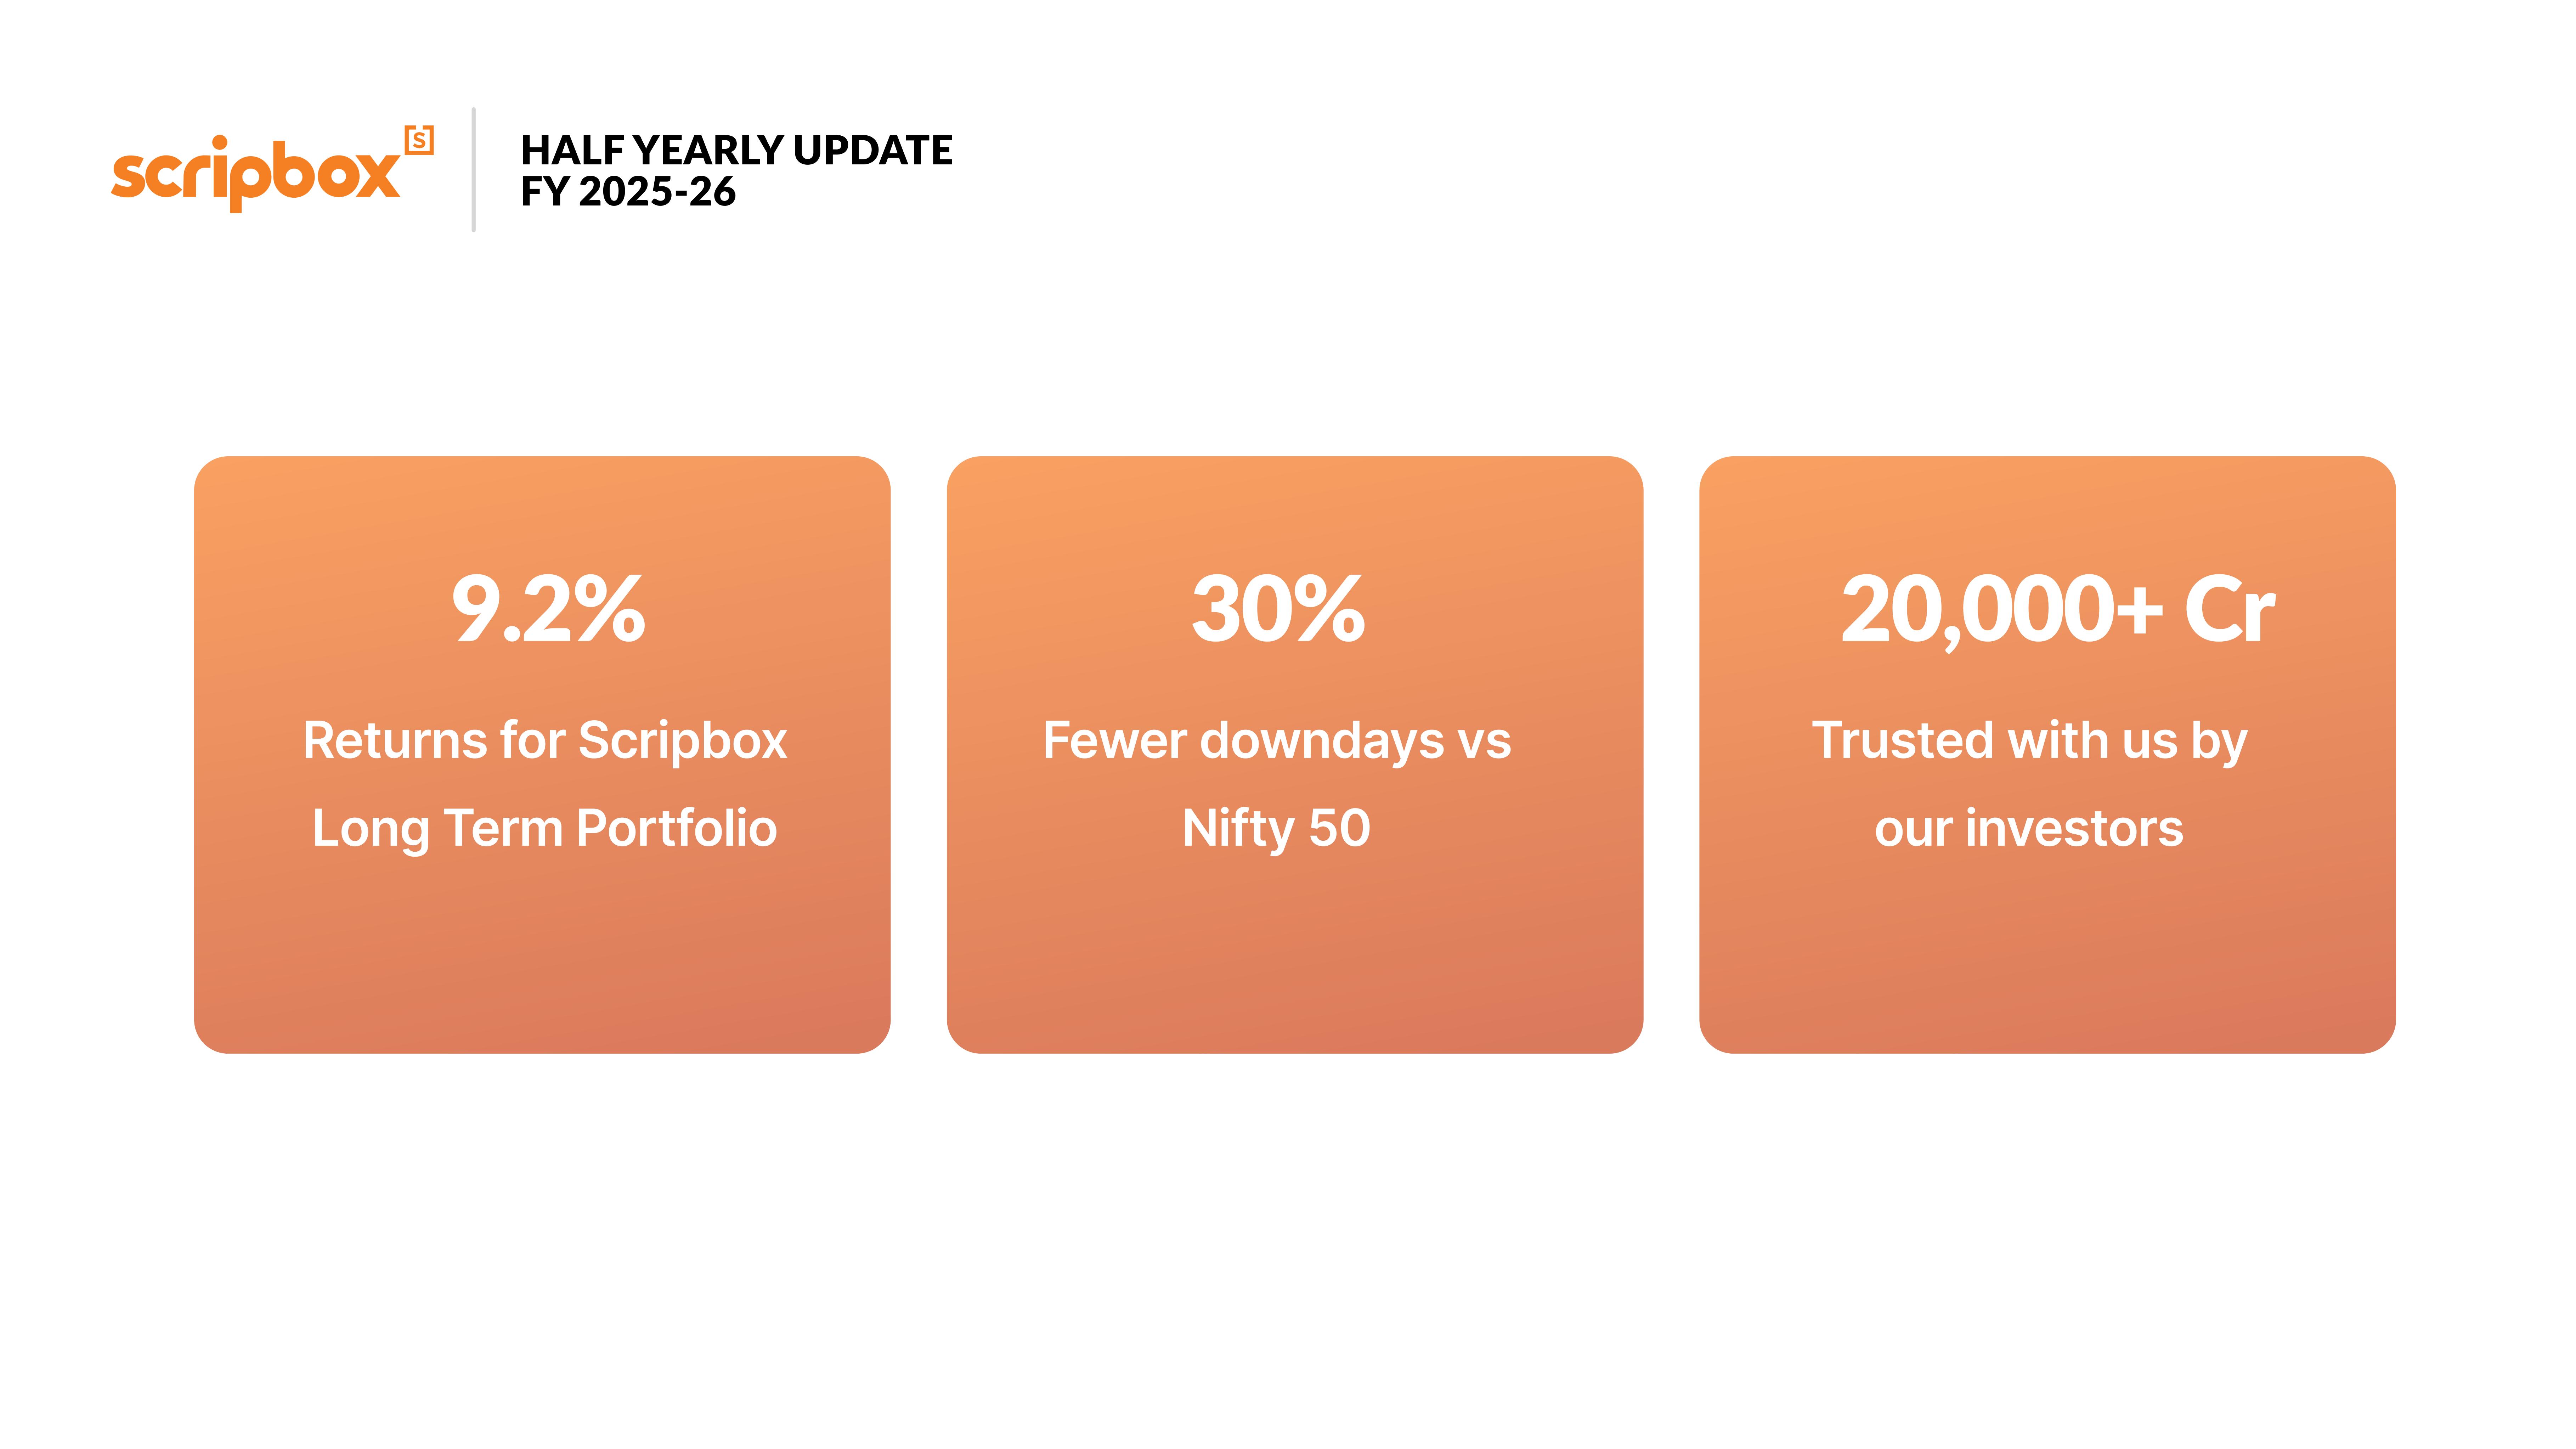
The first half of FY ’26 was all headlines—tariffs, border flashes, rate-cut surprises—yet through the chatter our Long Term Portfolio delivered 9.2% returns against Nifty’s 7.1%
Our asset allocation approach also provided strong protection against market volatility with a maximum drawdown* of 3.5 % compared to Nifty-50 TRI’s 5 % – an important advantage because it is much easier to recover from a shallow drop than a steep one as larger falls demand disproportionately higher returns just to break even.
This was possible with our 70:20:10 split between Equity, Debt and Gold funds, and this time the 10% in gold has done a lot of heavy lifting.
Gold often moved differently when equity markets swung around, cushioning short-term falls and helping the Long Term Portfolio stay on track. That’s exactly why we include it: not as a bet on gold prices, but as a built-in shock absorber so your overall portfolio can keep growing and protect wealth across different market conditions—especially the choppy ones.
Scripbox Equity Portfolio — Beating Nifty Even Without Gold
While the Long Term Portfolio’s outperformance was boosted by gold, our pure equity portfolio also pulled ahead of the market on its own strength. Over the first half of FY ’26, the Scripbox Equity Portfolio delivered 8.8% returns.
This outperformance is driven by our algorithmically driven fund selection (including our upgraded flexi-cap mix) rather than simply mirroring the index.
At the start of FY ’26, we increased flexi-cap exposure in our equity portfolio to 50% (from 34% in FY ‘25) and introduced HDFC Flexi Cap alongside Parag Parikh Flexi Cap Fund.
We also trimmed an oversized single-fund position in PPFC to spread that flexi-cap allocation across two strong but complementary managers, reducing dependence on a single style and balancing PPFC’s global-tilted approach with HDFC’s more domestically focused portfolio.
The decision has already worked in our clients’ favour, with HDFC Flexi Cap outpacing PPFC in the first half of the year.
Both of these funds were among the top 5 funds in the flexi-cap category, a testament to our ability of picking the best funds for you.
We’re on-track for another inflation-beating year
In the first half of FY ’26, our Long Term Portfolio delivered a 9.2% return for our clients — significantly outpacing inflation, which is forecasted to stay under 2.6% for FY ‘26.
This ensured that your purchasing power grows with time, meaning your money didn’t just keep up with inflation, it grew meaningfully beyond it.
Reiterating the core idea of Scripbox
A quick reflection on Scripbox’s core principles will help you understand this report card better.
- We firmly believe that investments should be evaluated from a long-term perspective, as time is the most crucial factor at work for wealth creation.
- We avoid human bias by relying on a rule-based portfolio construction and fund selection process, powered by our proprietary algorithm.
- We continue to track and monitor each fund, and proactively reach out to our clients when a portfolio change becomes necessary.
Table A: Performance of the Scripbox Recommended Funds (as of 30/09/2025)
| Category | Fund Name | 6 Months Return | 1 Year Return – FY ‘25 | 3 Year Annualised Return | 5 Year Annualised Return |
| Large / Flexi Cap / Value | HDFC Flexi Cap Fund(G) | 8.5% | 2.7% | 23.4% | 29.1% |
| Parag Parikh Flexi Cap Fund-Reg (G) | 6.9% | 3.2% | 21.7% | 21.8% | |
| HDFC Large and Mid Cap Fund-Reg (G) | 8.4% | -4.8% | 20.5% | 26.0% | |
| ICICI Pru Large Cap Fund(G) | 6.7% | -2.2% | 18.8% | 21.8% | |
| Debt / Emergency / Cash Management | Aditya Birla SL Money Manager Fund(G) | 7.4% | 7.7% | 7.6% | 6.2% |
| Aditya Birla SL Savings Fund-Reg(G) | 7.5% | 7.8% | 7.5% | 6.2% | |
| HDFC Floating Rate Debt Fund(G) | 8.1% | 8.1% | 7.9% | 6.6% | |
| Nippon India Arbitrage Fund(G) | 2.8% | 6.4% | 6.8% | 5.6% | |
| ICICI Pru Liquid Fund(G) | 6.2% | 6.8% | 7.0% | 5.6% | |
| Gold | HDFC Gold ETF | 55.9% | 51.0% | 30.2% | 16.9% |
| Kotak Gold Fund(G) | 54.9% | 49.5% | 29.5% | 16..3% | |
| Tax Saving | DSP ELSS Tax Saver Fund-Reg(G) | 4.5% | -5.1% | 19.6% | 23.4% |
| SBI Long Term Equity Fund-Reg(G) | 4.8% | -6.0% | 24.1% | 24.8% | |
| Benchmark Indices | NIFTY 50 TRI | 5.5% | -3.4% | 14.2% | 18.3% |
| NIFTY 500 TRI | 7.3% | -5.3% | 16.4% | 20.7% | |
| Nifty Midcap 100 TRI | 9.8% | -5.5% | 23.3% | 28.1% | |
| Nifty Smallcap 250 TRI | 11.0% | -8.8% | 22.7% | 28.2% |
Note: Scripbox Equity Portfolio returns are based on mutual fund NAVs, which reflect actual investor experience post all costs such as fund management fees and expenses. In contrast, Nifty 50 TRI represents gross index performance including dividends but excludes any investment costs. This distinction is important while evaluating performance differences.


Show comments