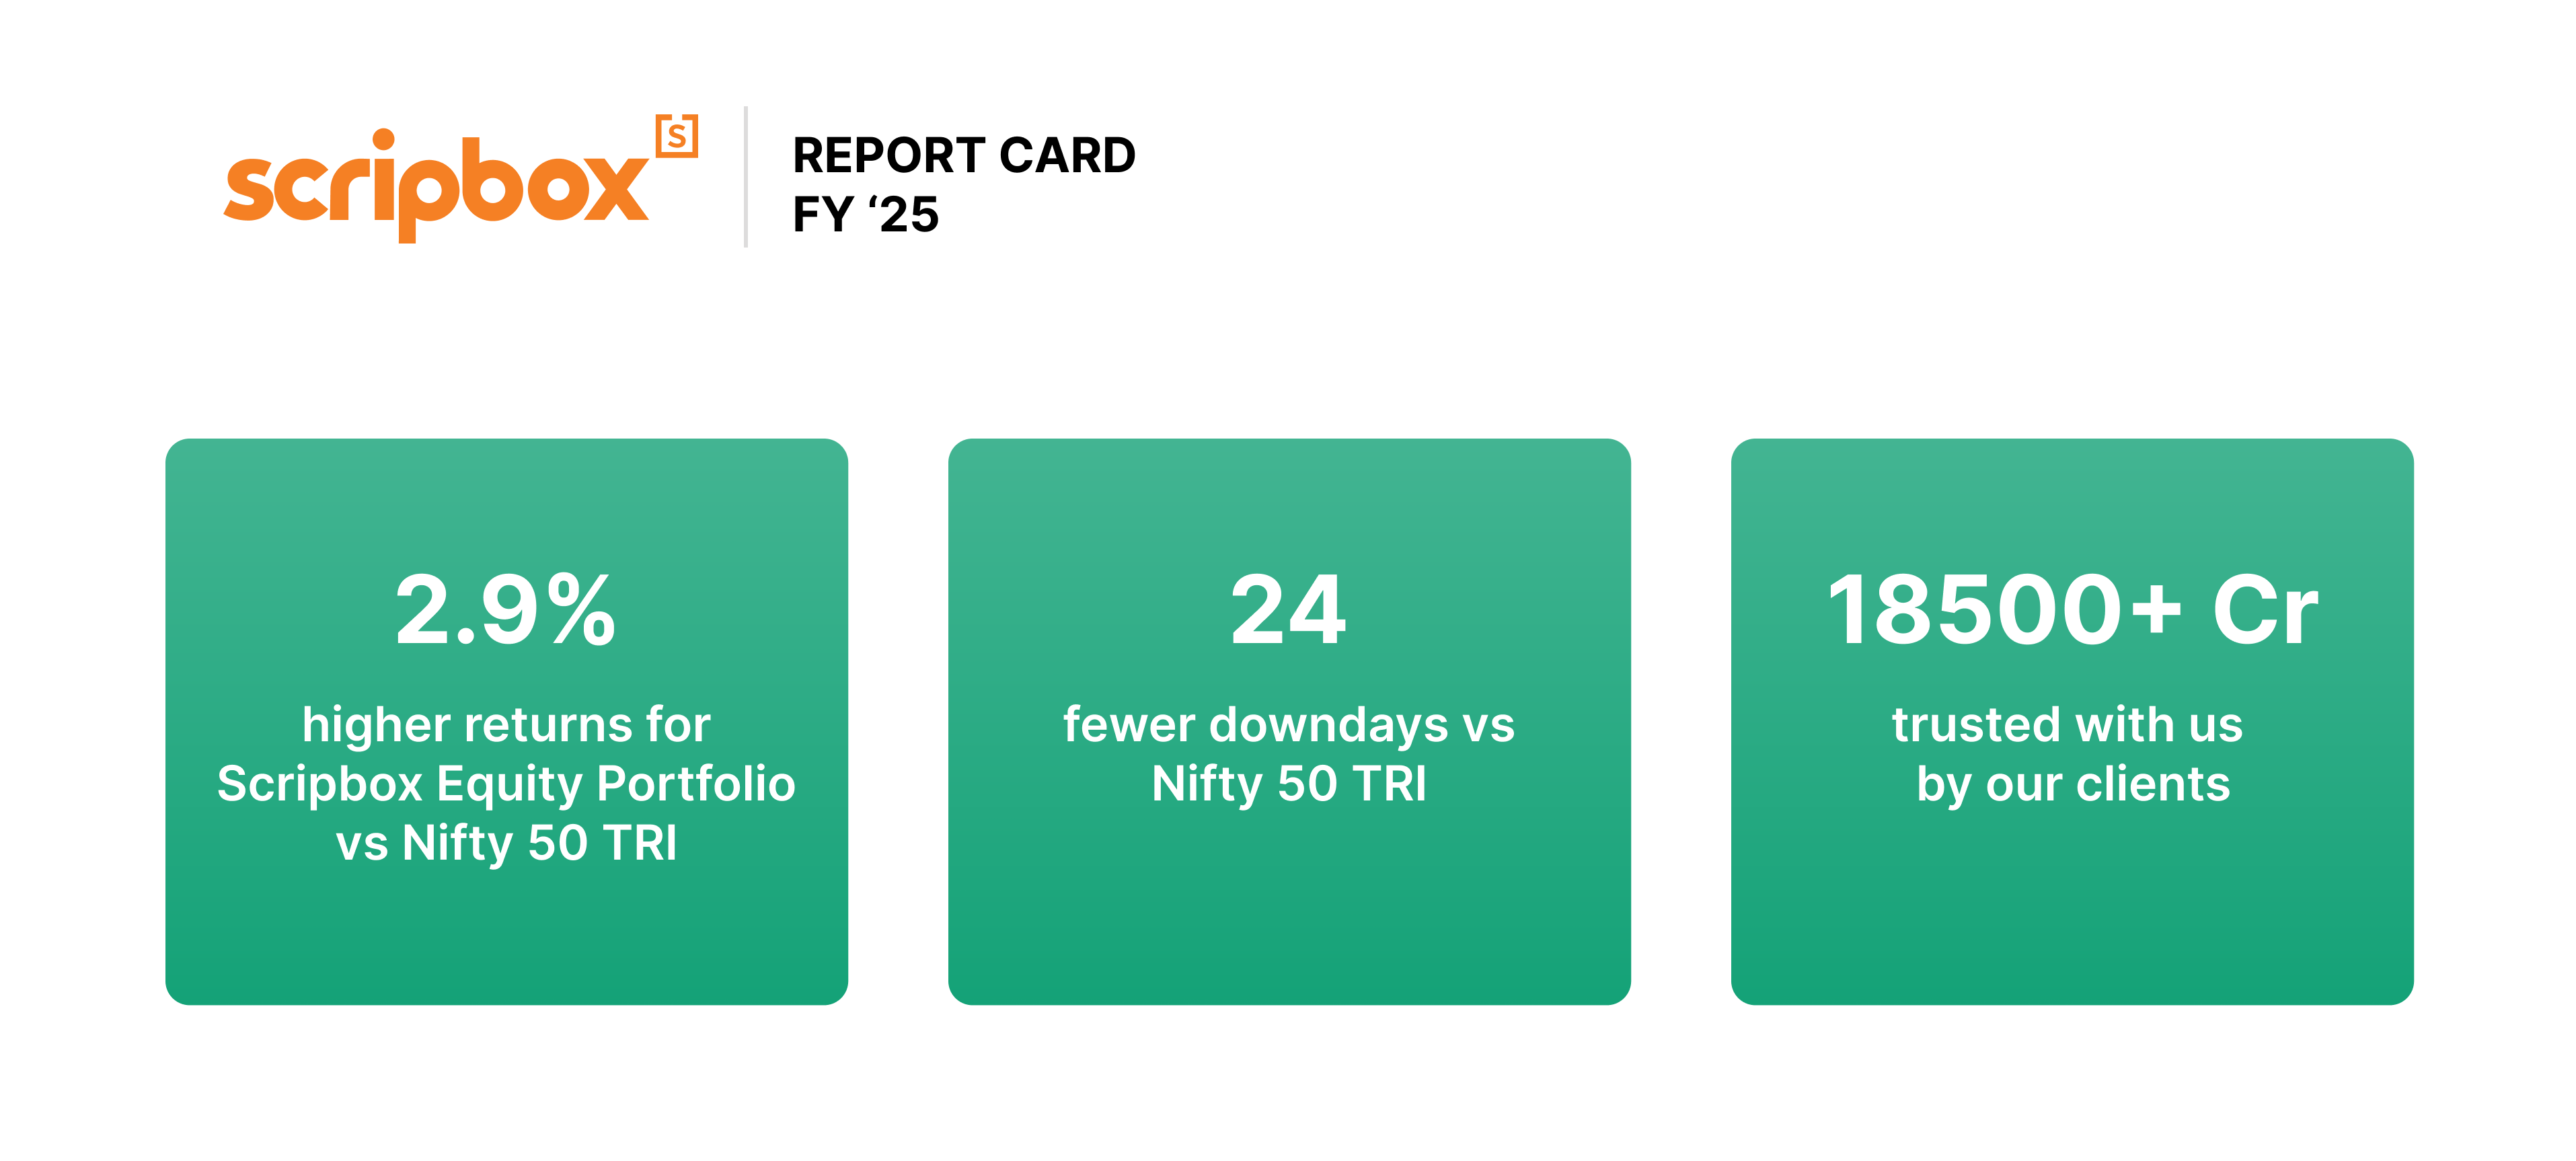
Scripbox Equity Portfolio: Delivering higher returns than benchmark despite a highly volatile year
In a year that tested investors’ resilience and long-term commitment, the Scripbox Equity Portfolio not only weathered the storm but thrived by outperforming the benchmark Nifty 50 TRI.
The FY 24-25 comparison chart between Scripbox Equity and the benchmark also reflects this superior performance.
Detailed category-level fund performance is provided in Table A below.
Consistent performance over time
Scripbox Equity Portfolio has beaten the Nifty 50 TRI in 10 out of 14 reporting periods since 2012.
Outperformance over the benchmark is what our fund selection algorithm is designed to achieve. This consistent and research-driven approach is what helps you move towards your financial goals effectively.
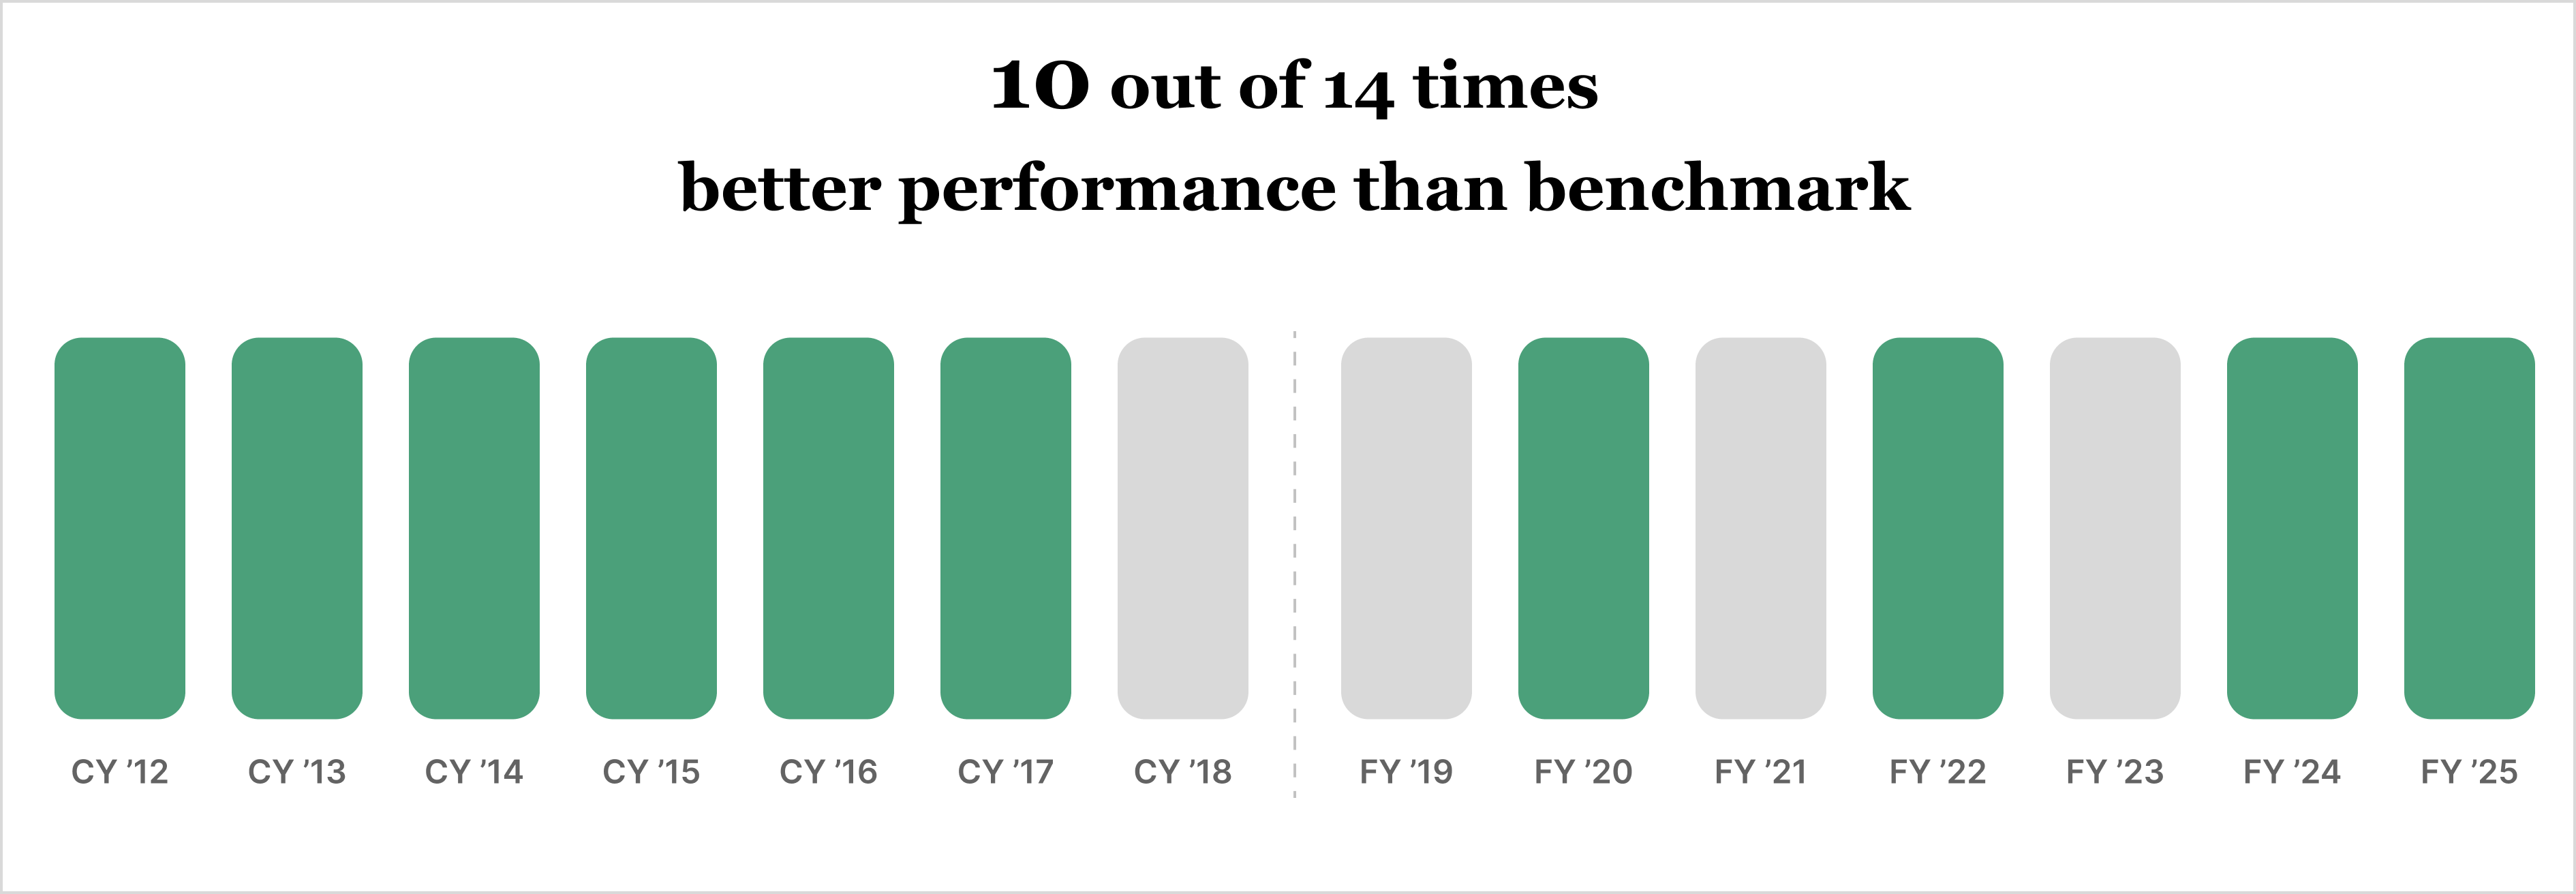
Further, the 3-year CAGR performance of our Equity Portfolio is a robust 14.5%
Stability focused Long Term Portfolio
Scripbox Long Term Portfolio—trusted by the majority of our clients—employs a scientifically backtested asset allocation across equity, debt and gold. This year, we added higher allocation to equity while trimming down gold exposure by 5%.
Our asset allocation approach provides protection against market volatility.
With a maximum drawdown (max drop from last peak) of 8.6% compared to the Nifty 50 TRI’s 15.4%, our Long Term Portfolio effectively shielded our clients’ wealth from steeper market drops—a critical advantage since larger value declines require significantly higher subsequent returns just to break even.
As you can see from the below chart, our portfolio construction approach made it easier for our clients to handle market volatility by reducing its impact on their portfolios by approximately half.
Proactively removing midcap funds from our recommended list in April 2024 helped minimize client exposure to the sharp corrections seen in these segments in the latter half of the year.
As a result, the Scripbox Long Term Portfolio was more resilient with only 98 downdays (days when your portfolio value was lower than previous day), compared to the 122 downdays for the benchmark.
Preserving purchasing power for Scripbox Clients
In FY ’25, our Long Term Portfolio delivered a 11.06% return for our clients — significantly outpacing inflation, which stood at 4.8% during the same period.
This ensured that your purchasing power grew year on year, meaning your money didn’t just keep up with inflation, it grew meaningfully beyond it.
| 1 April 2024 | 31 March 2025 | |
| Invested in Long Term Portfolio | ₹ 10,00,000 | ₹ 11,10,600 |
| Inflation adjusted* | ₹ 10,00,000 | ₹ 10,48,000 |
Reiterating the core idea of Scripbox
A quick reflection on Scripbox’s core principles will help you understand this report card better.
- We firmly believe that investments should be evaluated from a long-term perspective, as time is the most crucial factor at work for wealth creation.
- We avoid human bias by relying on a rule-based portfolio construction and fund selection process, powered by our proprietary algorithm.
- We continue to track and monitor each fund, and proactively reach out to our clients when a portfolio change becomes necessary.
Table A: Performance of the Scripbox Recommended Funds
| Category | Fund Name | 1 Year Return – FY ‘25 | 3 Year Annualised Return | 5 Year Annualised Return |
| Large / Flexi Cap / Value | Parag Parikh Flexi Cap Fund-Reg(G) | 13.8% | 16.8% | 30.3% |
| HDFC Large and Mid Cap Fund-Reg(G) | 7.7% | 18.7% | 30.8% | |
| ICICI Pru Bluechip Fund(G) | 7.1% | 16.2% | 26.5% | |
| ICICI Pru Value Discovery Fund(G) | 10.7% | 19.9% | 32.8% | |
| Debt / Emergency / Cash Management | Aditya Birla SL Money Manager Fund(G) | 7.7% | 7.0% | 6.2% |
| Aditya Birla SL Savings Fund-Reg(G) | 7.8% | 6.9% | 6.2% | |
| HDFC Floating Rate Debt Fund(G) | 8.3% | 7.2% | 6.8% | |
| Nippon India Arbitrage Fund(G) | 7.2% | 6.5% | 5.4% | |
| ICICI Pru Liquid Fund(G) | 7.3% | 6.7% | 5.4% | |
| Gold | HDFC Gold Fund(G) | 30.3% | 18.4% | 14.2% |
| Kotak Gold Fund(G) | 30.6% | 18.1% | 13.7% | |
| Tax Saving | DSP ELSS Tax Saver Fund-Reg(G) | 16.6% | 17.9% | 28.9% |
| SBI Long Term Equity Fund-Reg(G) | 10.2% | 23.3% | 31.3% | |
| Benchmark Indices | NIFTY 50 TRI | 6.7% | 11.8% | 23.7% |
| NIFTY 500 TRI | 6.4% | 13.9% | 26.3% | |
| Nifty Midcap 100 TRI | 8% | 21.1% | 35.7% | |
| Nifty Smallcap 250 TRI | 6% | 17.9% | 37.5% |
Note: Scripbox Equity Portfolio returns are based on mutual fund NAVs, which reflect actual investor experience post all costs such as fund management fees and expenses. In contrast, Nifty 50 TRI represents gross index performance including dividends but excludes any investment costs. This distinction is important while evaluating performance differences.


Show comments