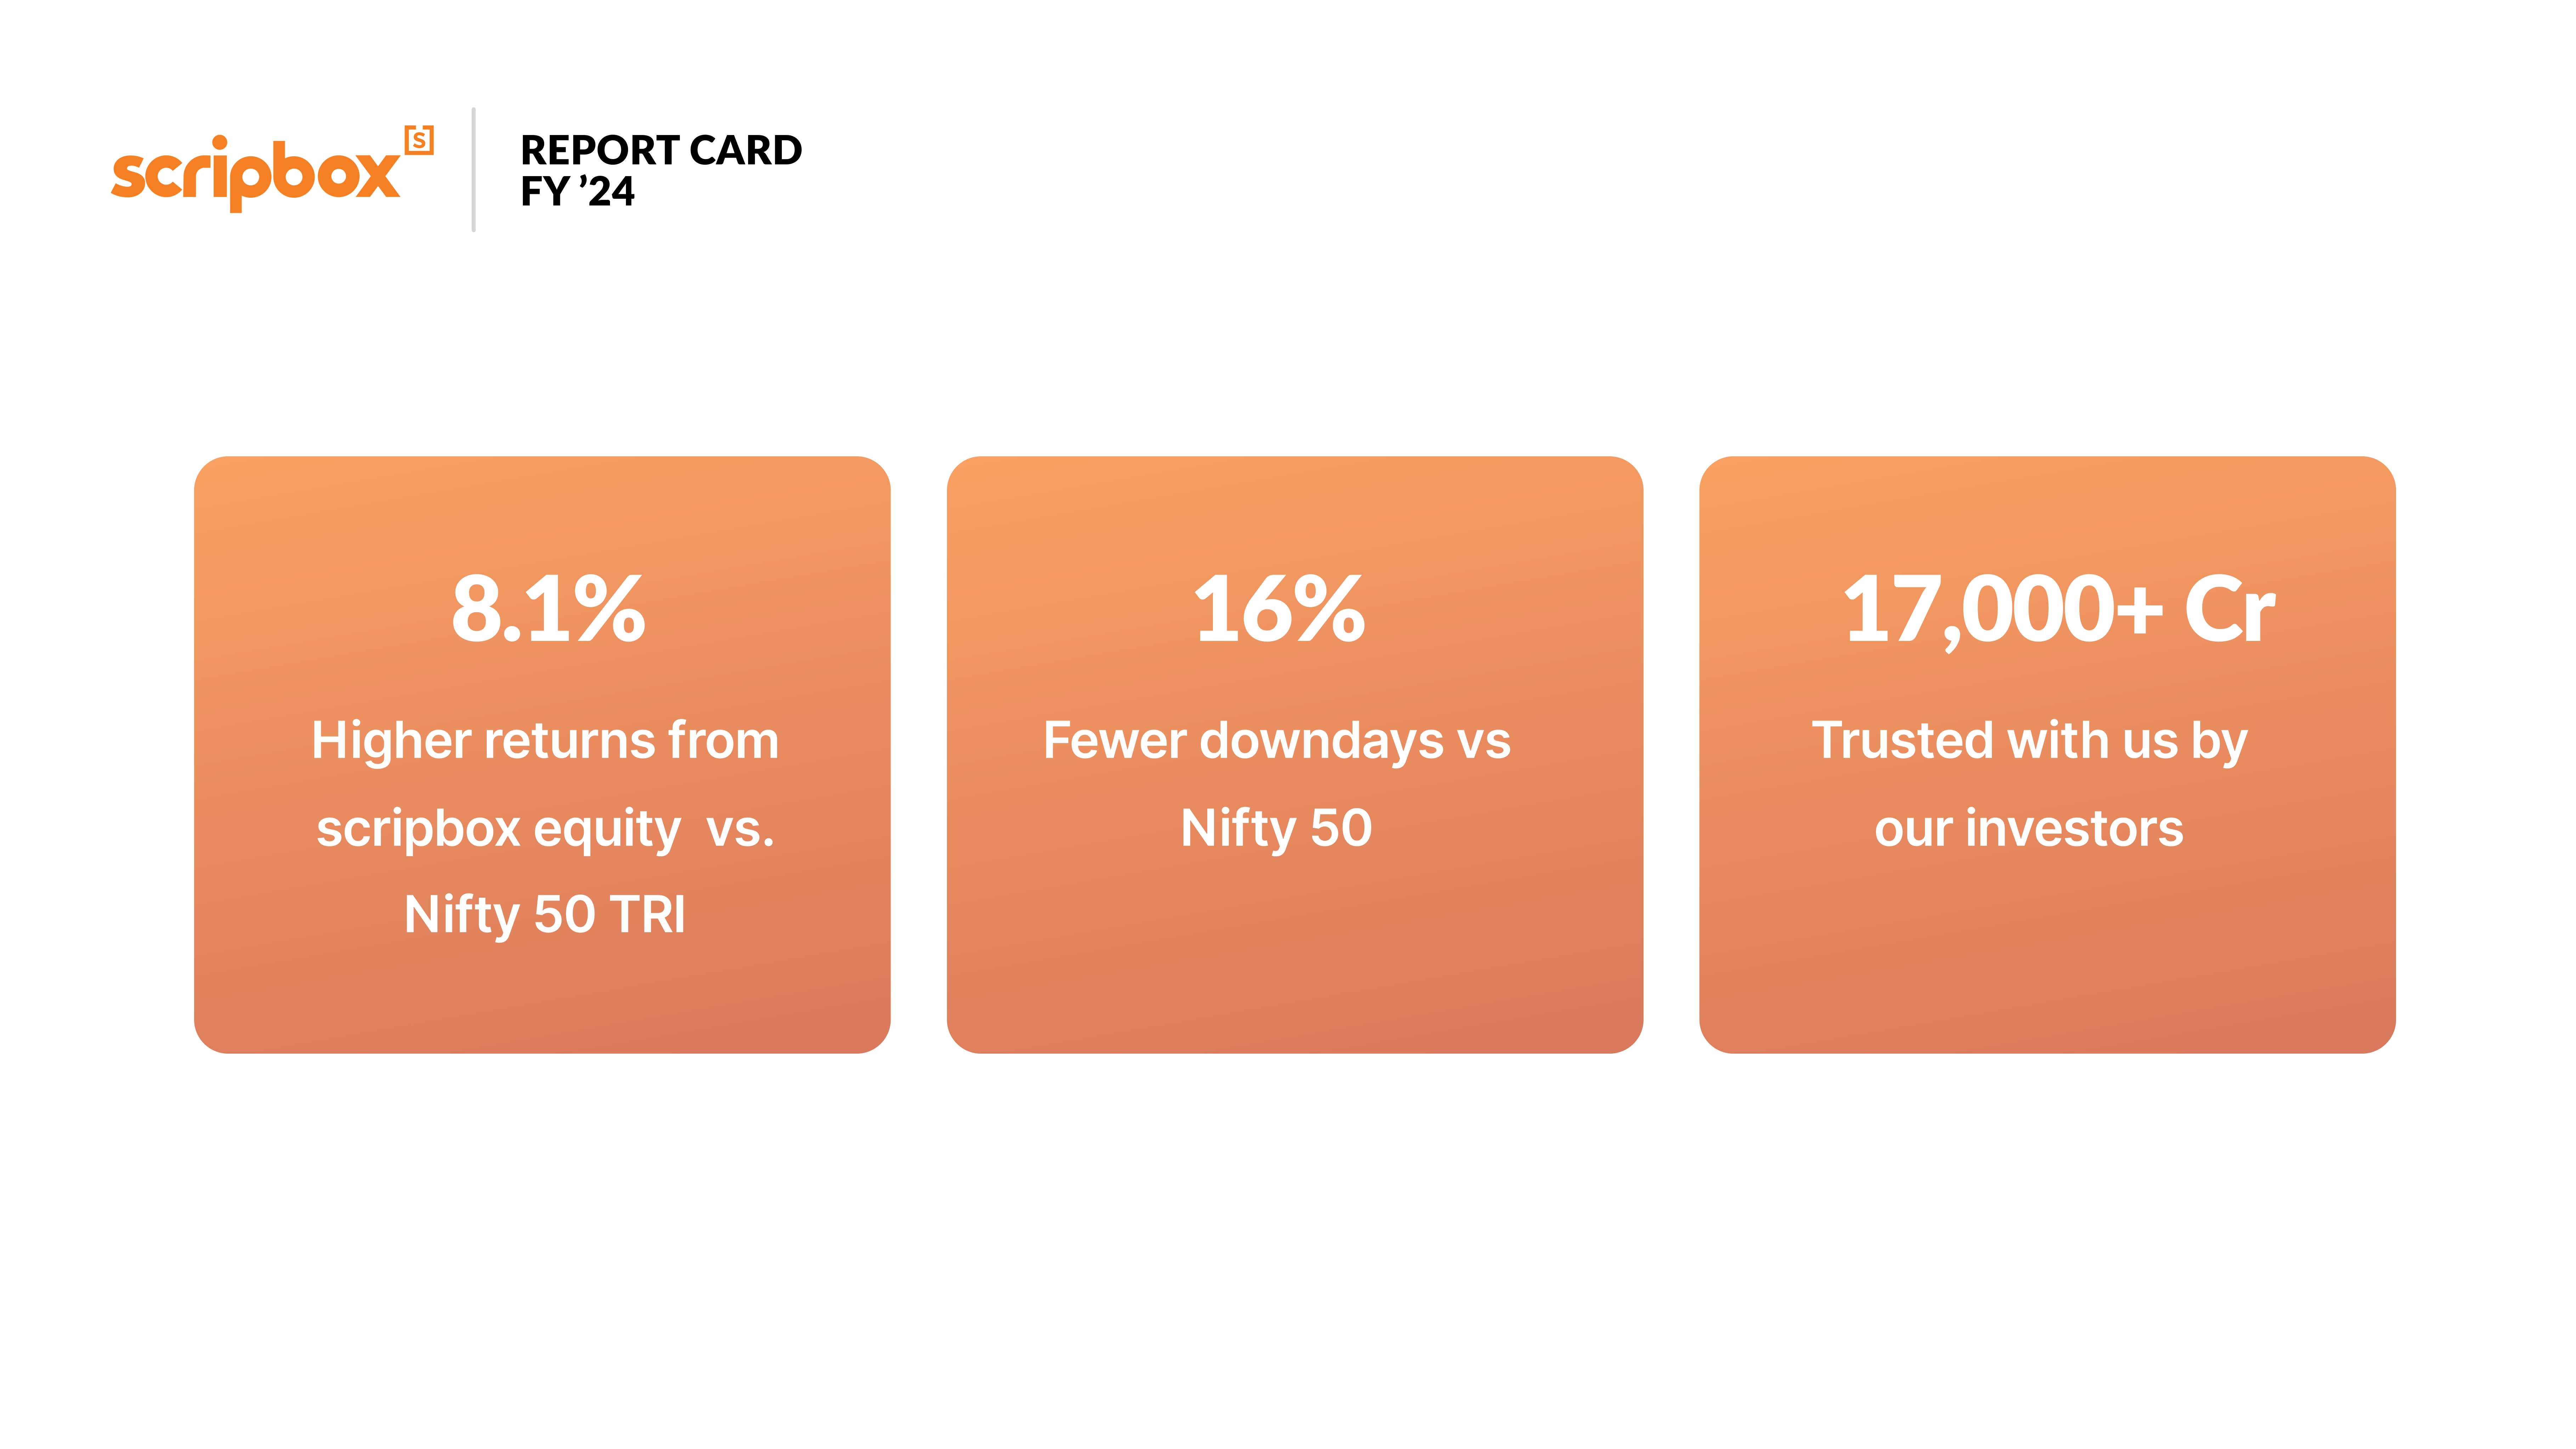
Scripbox Equity Portfolio outperformed the benchmark in 2024
In FY ’24, when equity markets thrived, our carefully selected equity funds outperformed Nifty 50 TRI.
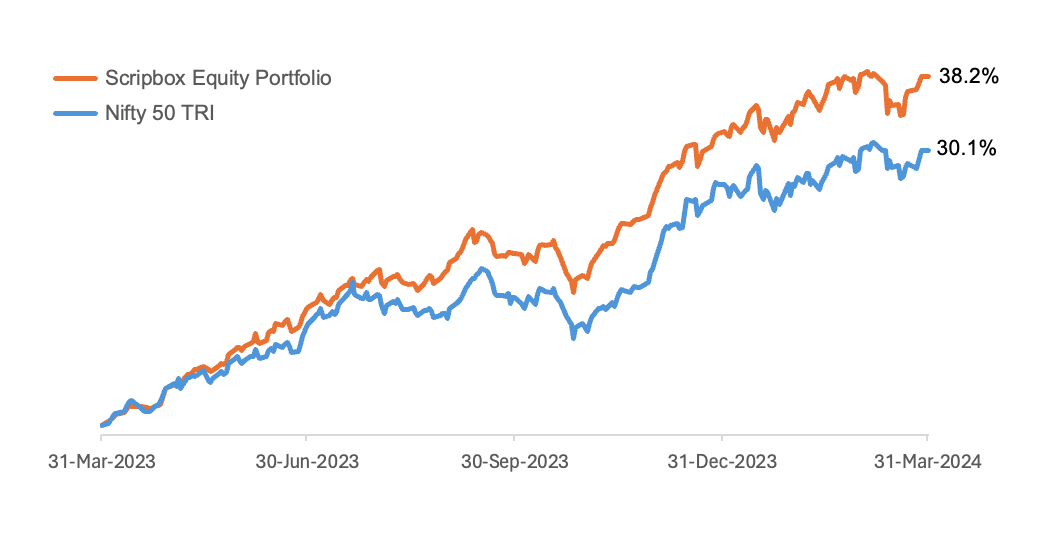
₹1,00,000 invested on 1 April 2023, after one year would have become:
| Scripbox Recommended | Nifty 50 – TRI | SBI Fixed Deposit* |
| ₹ 1,38,200 | ₹ 1,30,100 | ₹ 1,07,000 |
The FY ’24 comparison chart (day-by-day) between Scripbox Equity and the benchmark also reflects this superior performance.
Detailed category-fund level performance is provided in Table A below.
Confused if your portfolio is performing right enough to meet your goals?

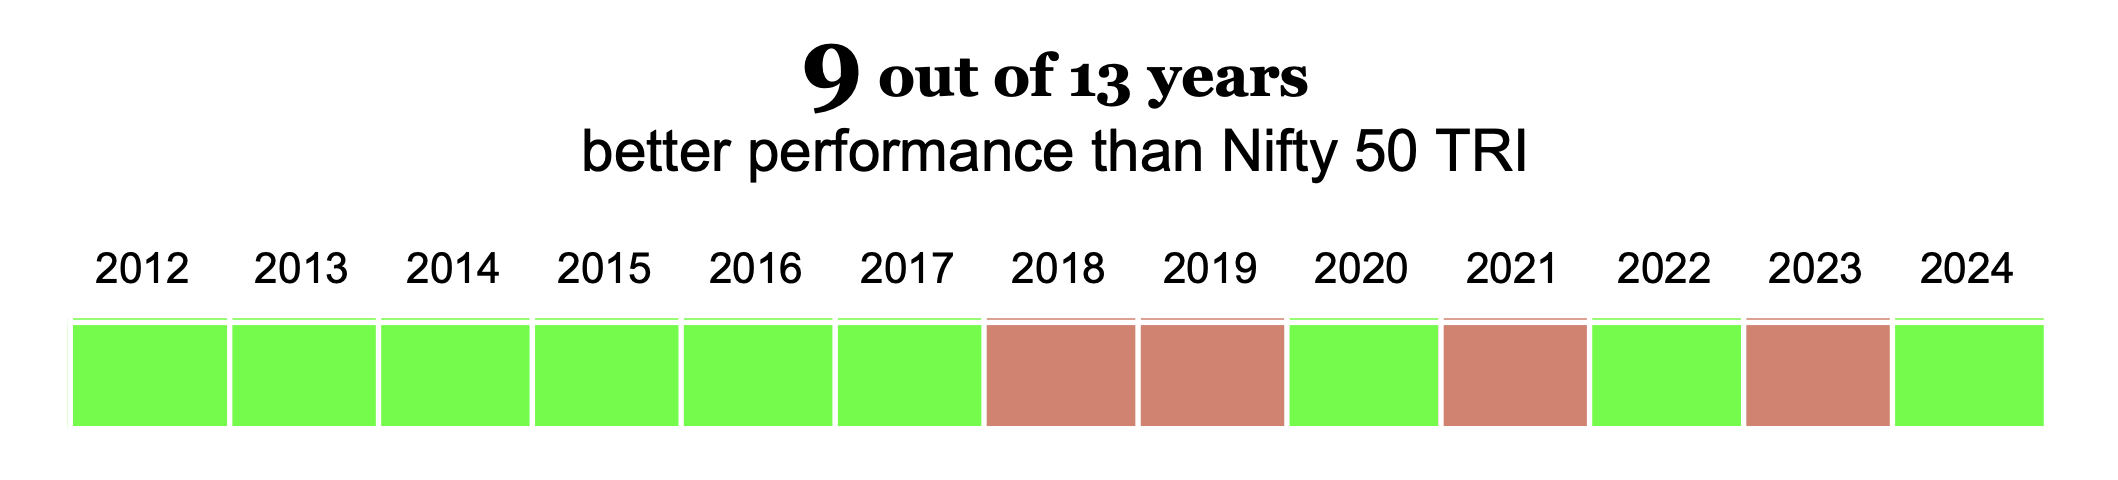
Consistent performance over time
The Scripbox Equity portfolio has a robust track record – it has done better than benchmark in 9 of the last 13 years—since we started. This steady performance of your investments over time is important to achieve your financial goals, and is a principle reflected in our fund selection criteria.
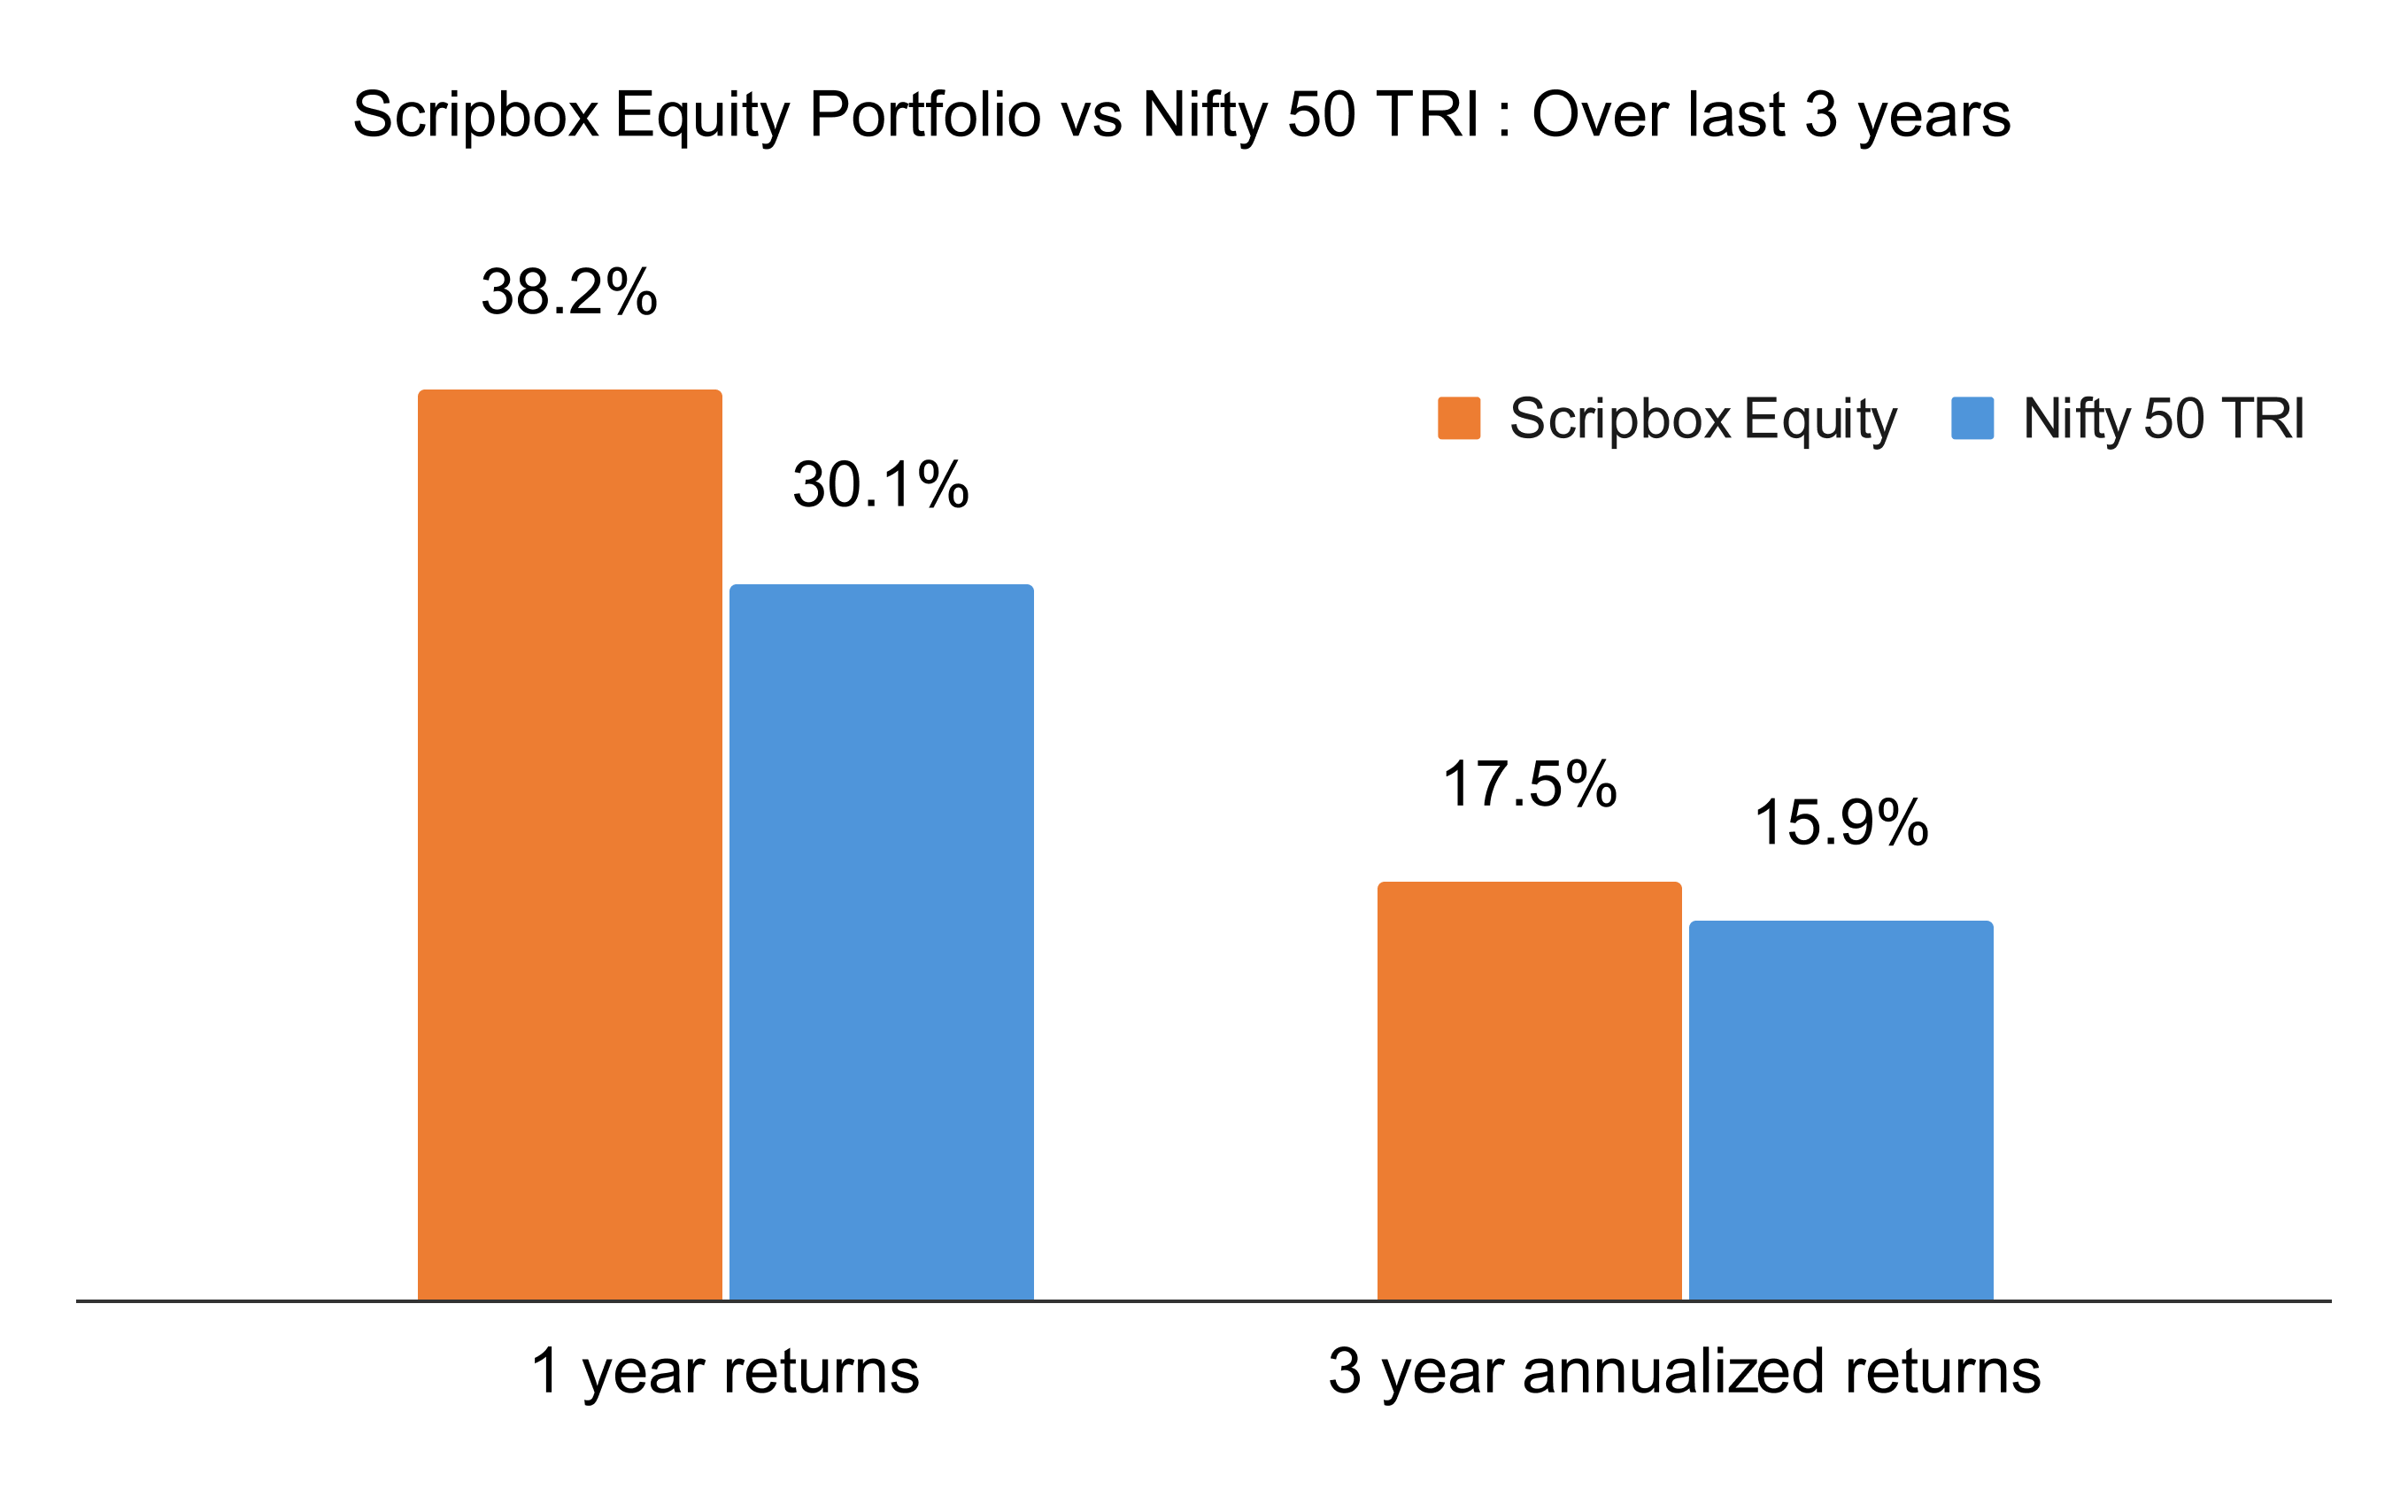
Further, our cumulative 3 year performance is a robust 17.5%. Please note that since the performance is based on mutual fund NAV, it incorporates all costs of investing.
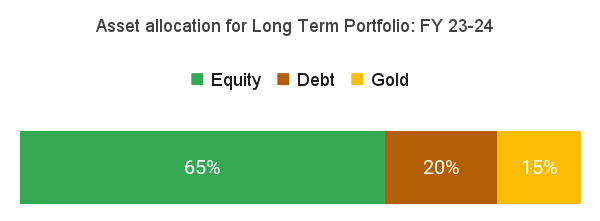
Stability focused Long Term Portfolio
Scripbox Long Term Portfolio—trusted by the majority of our investors—employs a scientifically backtested asset allocation across equity, debt and gold.
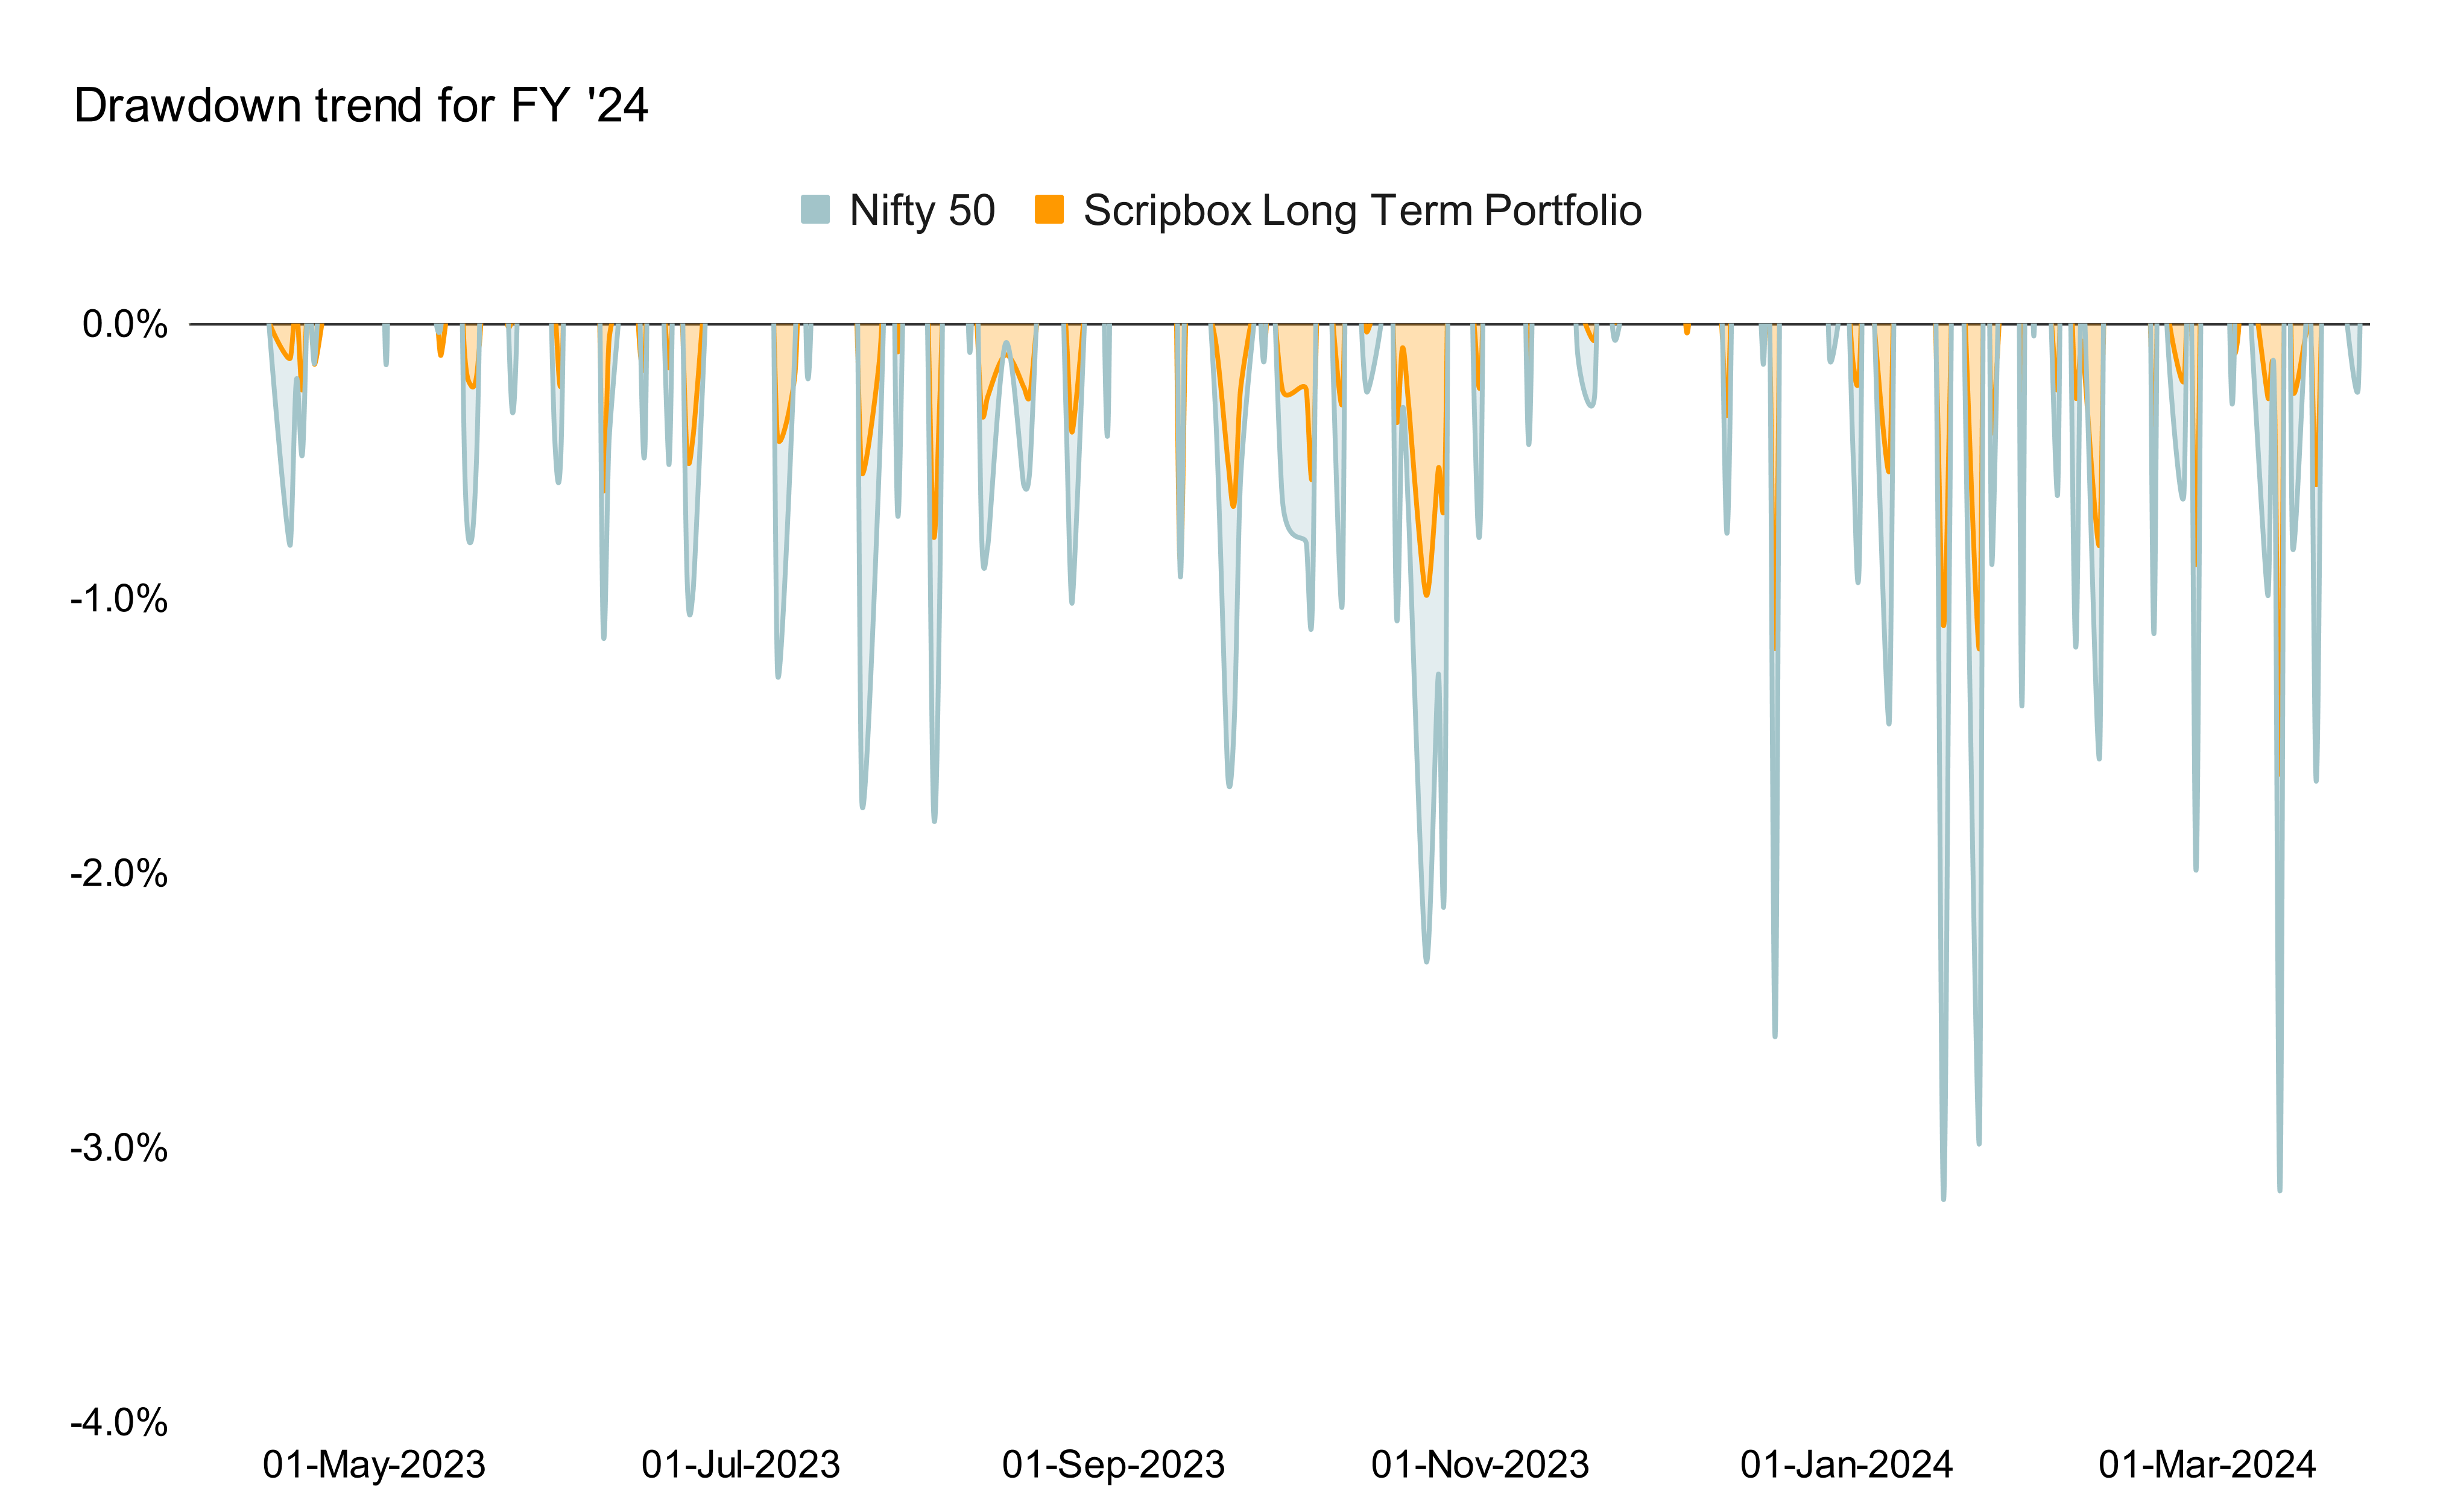
The asset allocation approach provides protection against market volatility. As a result, the Scripbox Long Term Portfolio was more resilient with only 75 downdays (days with negative returns), compared to the 89 downdays for the benchmark.
Additionally, this portfolio saw a maximum drawdown (fall from previous high) of just 3.5% compared to 6.8% in Nifty 50 TRI; protecting the wealth of our customers from steep drops in the market.
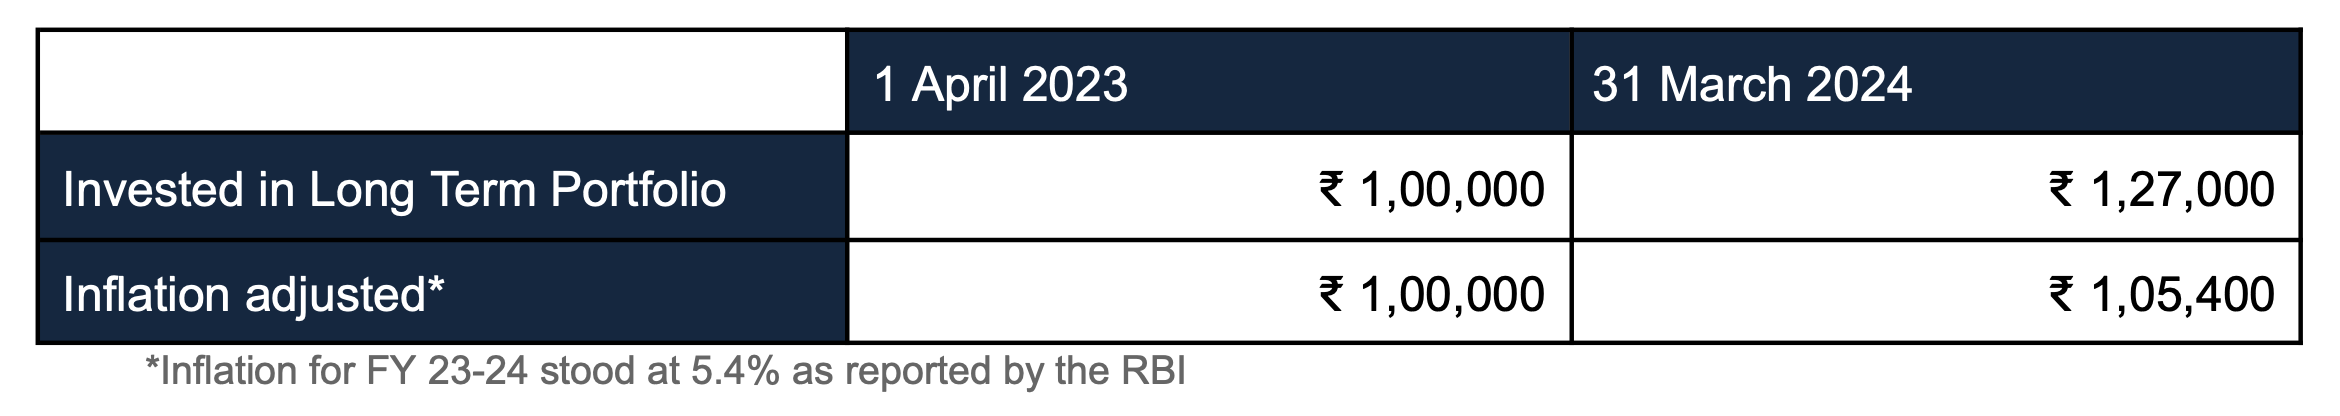
Preserving purchasing power for Scripbox investors
In FY ’24, our Long Term Portfolio delivered returns of 27%, beating inflation and ensuring your purchasing power has grown.
Reiterating the core idea of Scripbox
A quick reflection on Scripbox’s core principles will help you understand this report card better.
- We firmly believe that investments should be evaluated from a long-term perspective, as time is the most crucial factor at work for wealth creation.
- We avoid human bias by relying on a rule-based portfolio construction and fund selection process, powered by our proprietary algorithm.
- We continue to track and monitor each fund, and proactively reach out to our investors when a portfolio change becomes necessary.
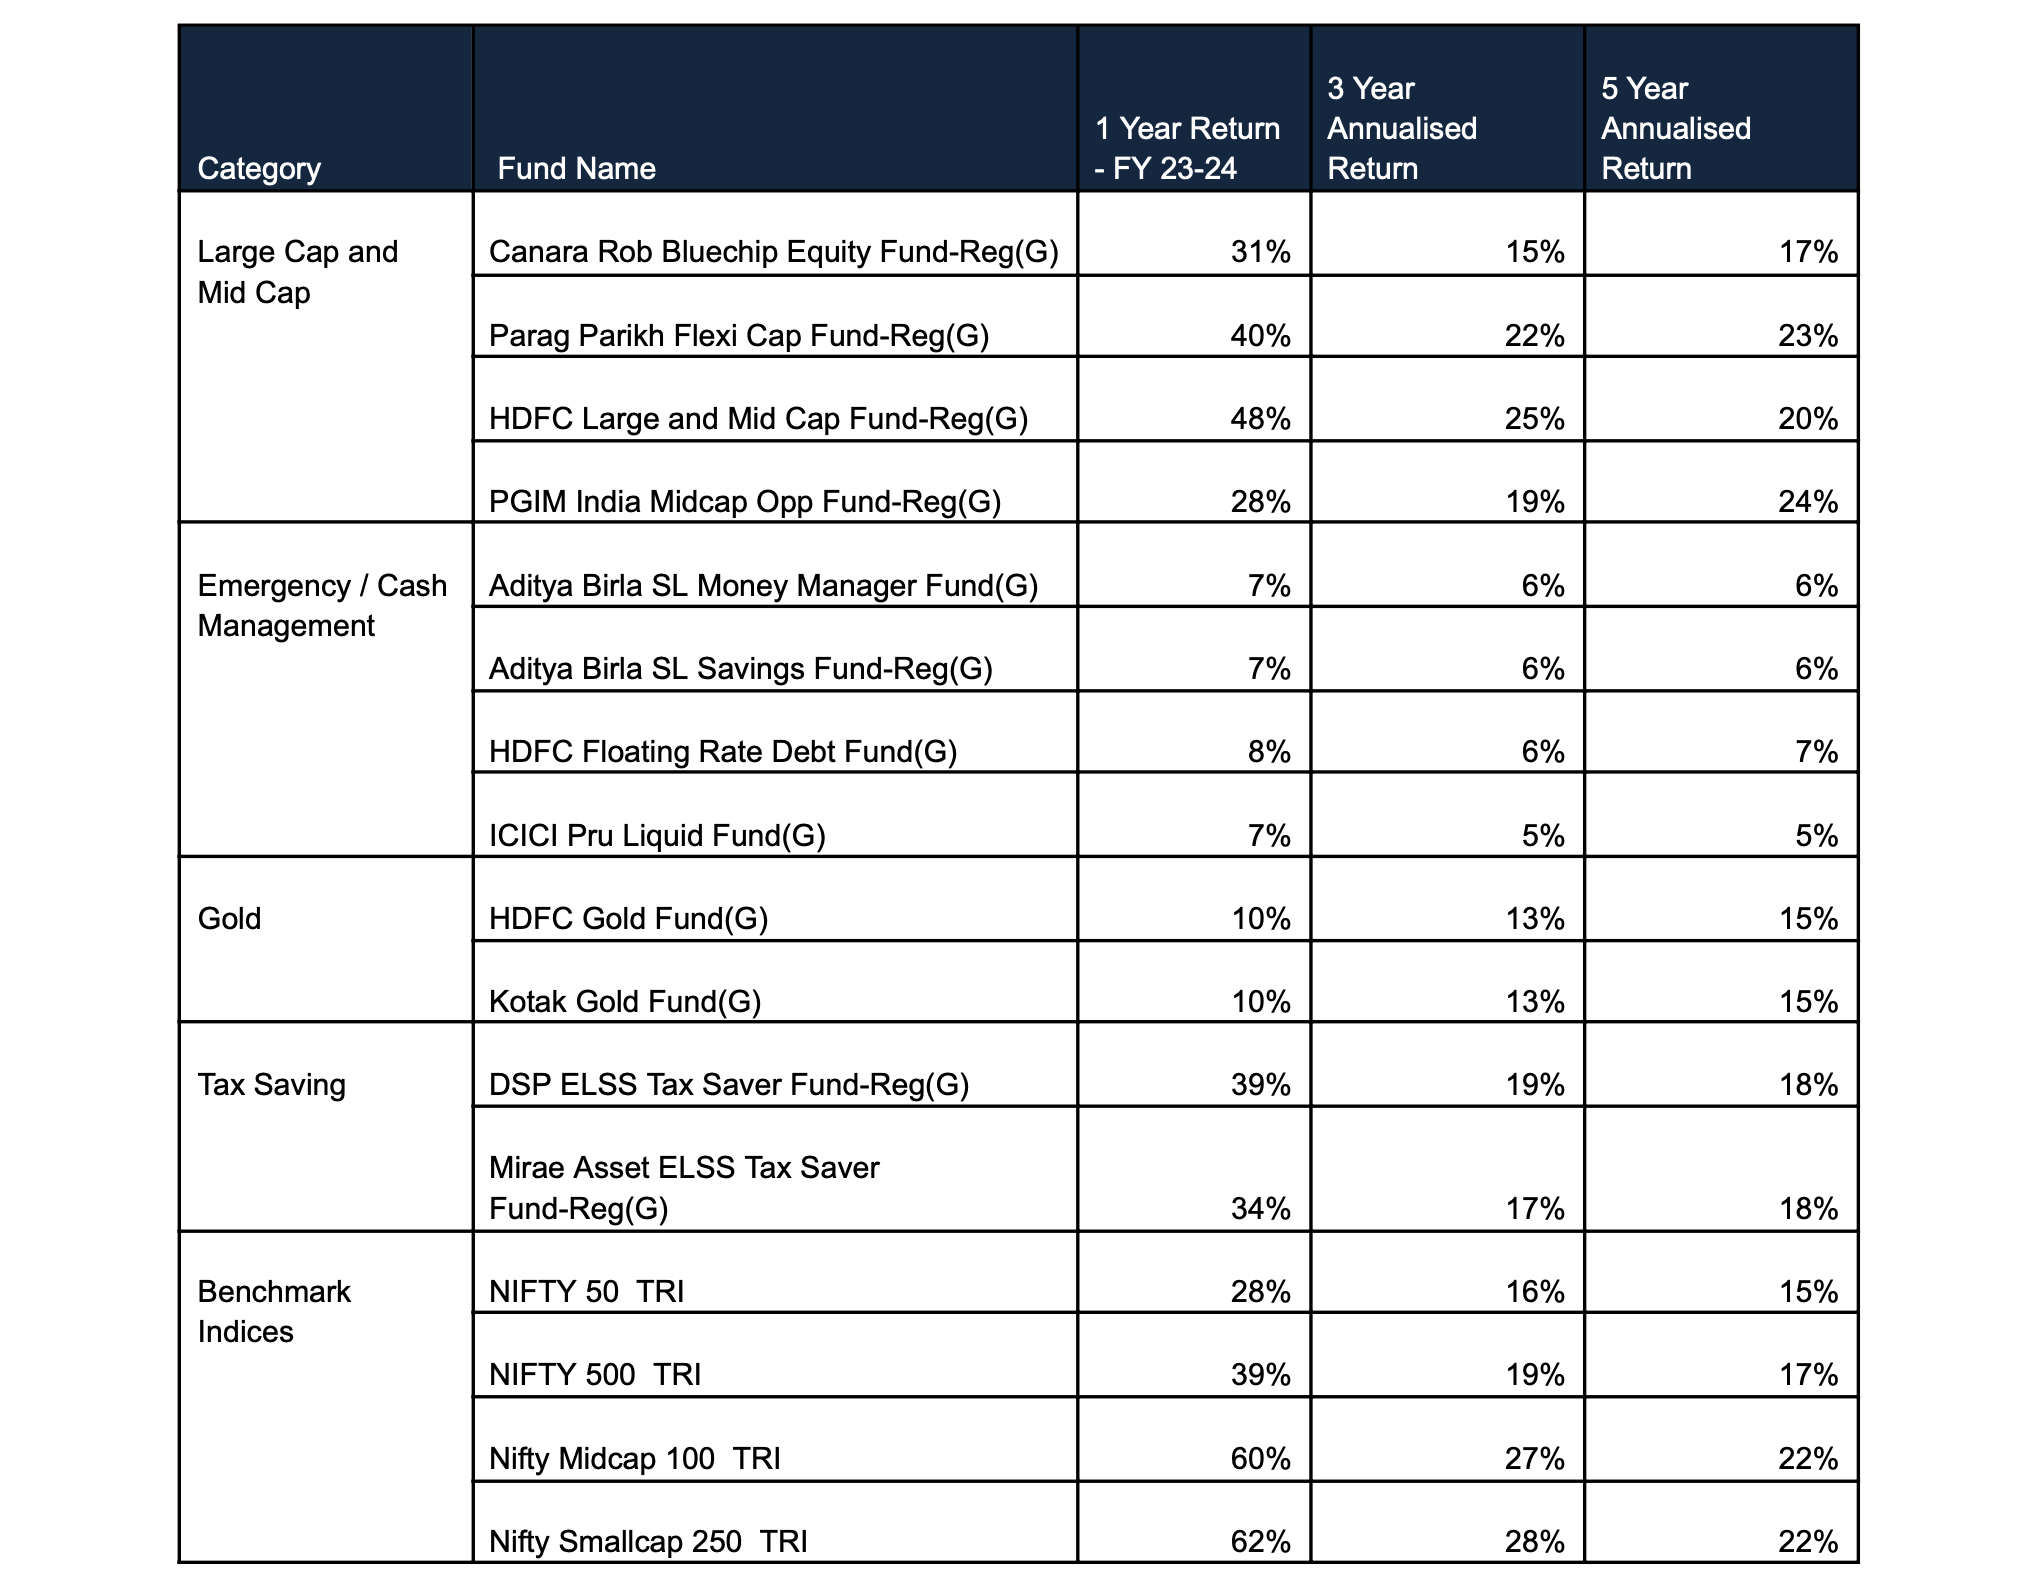
Table A: Performance of the Scripbox Recommended Funds


Show comments